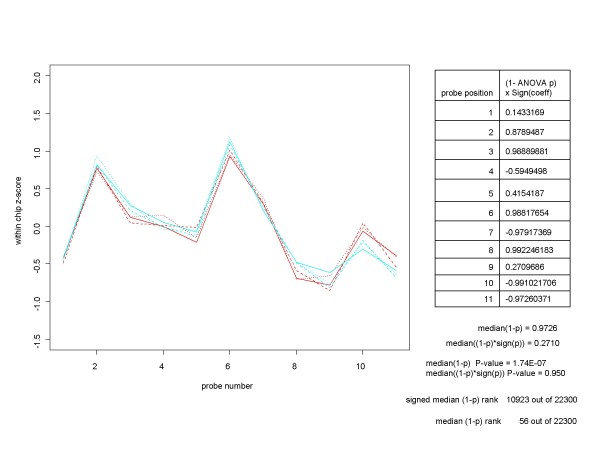
Figure 3.
An example of why the median of the signed (1-p)'s is a better measure of differential expression than the median of the unsigned (1-p)'s. This chart depicts a common situation for non-spiked-in genes, such as 217207_s_at from the HGU-133A Latin Square experiment. The probe set plot and ANOVA results for the gene are shown for two of the experimental conditions, which we will designate by A (replicates in red) and B (replicates in cyan). At some probe positions the mean for condition A is larger than that for condition B, while the opposite is true at other probe positions. When we take this into account by multiplying each (1-p) by the sign of the ANOVA coefficient at that probe position before taking the median, we get a much better measure of differential expression for the gene.

