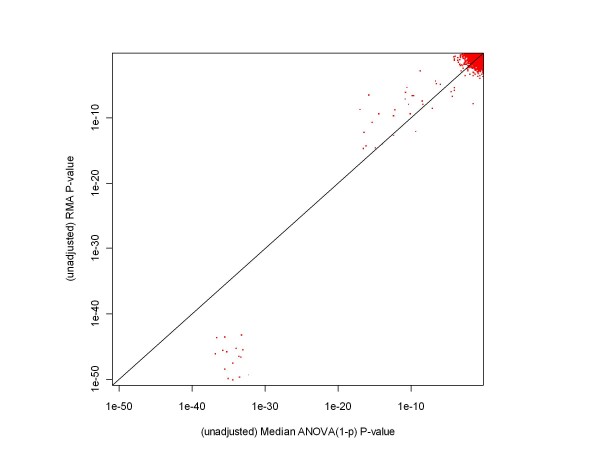
Figure 5.
A comparison of p-values obtained from median ANOVA (1-p) and RMA processing of a chosen pair of HGU-133A test conditions. This chart shows that, based on their unadjusted p-values, median ANOVA (1-p) and RMA are in rather good agreement for unexpressed genes and genes with a factor of two difference in initial concentrations. There is quite a large difference in p-values for genes whose concentration changes from 512 to 0 pM, but that difference has no impact on whether the genes are declared differentially expressed or not.

