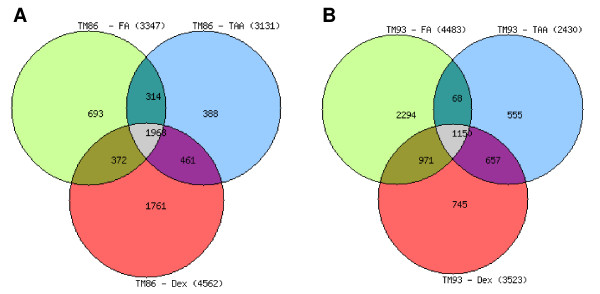
Figure 4.
Venn diagrams showing the distribution and overlap of differentially expressed genes in TM 86 (A) and TM 93 (B) cells. TM cells were treated with dexamethasone, fluocinolone acetonide, or triamcinolone acetonide at 1 μM for 24 hr. The two criteria for the identification of significantly different gene expression were log ratio p < 0.001 and log (10) intensity measurement >-1.8.

