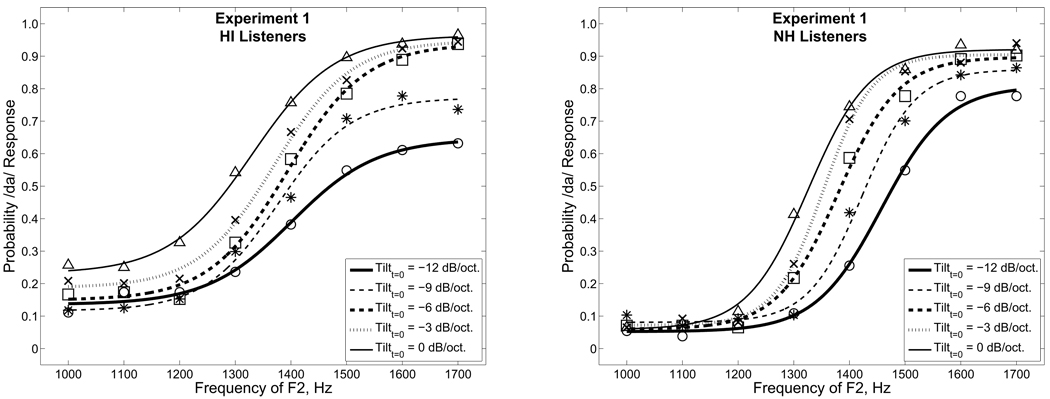
Figure 2.
Identification rates for mean data of HI and NH listeners in Experiment 1 are plotted in the left and right panels, respectively. Probability of responding /da/ as a function of F2-onset frequency is plotted separately for each consonant onset tilt. Circles, asterisks, squares, x’s, and triangles represent mean data for consonant onset tilts of −12, −9, −6, −3, and 0 dB/oct., respectively. Maximum-likelihood fits of identification rates are displayed for mean data at each consonant onset tilt as different lines (see legend).

