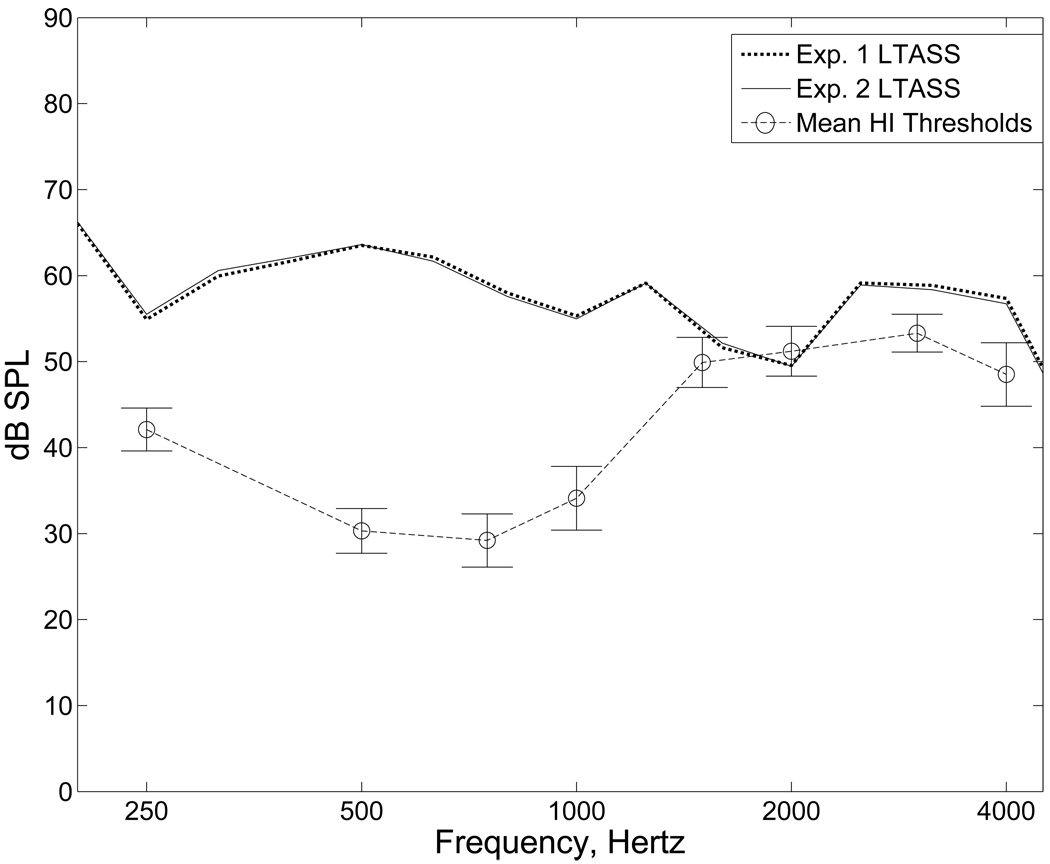
Figure 4.
The 1/3 octave band long-term average speech spectra (LTASS) of consonant onsets (t = 0–30ms) for Experiments 1 and 2 (dotted and solid lines, respectively) plotted against mean thresholds in dB SPL of HI listeners (dashed line). Error bars represent standard error of the mean. Note that LTASS of onsets are essentially identical across the two experiments.

