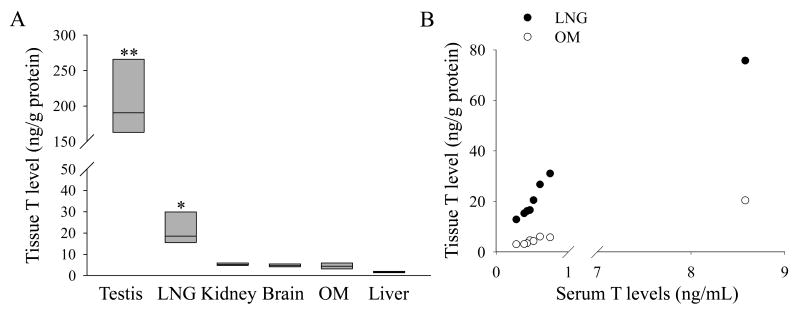
Fig. 1. Serum and tissue T level in male mice.
(A). T levels in various tissues. T levels were determined for 8-week old male mice (n=8). One of the mice tested was found to have exceptionally high serum, as well as tissue, T levels, causing the data to fail the normality test. Therefore, significance of differences in T levels among the tissues was analyzed using the Kruskal-Wallis one-way analysis. The values shown are the medians, together with the 25% (lower bar) and 75% (upper bar) percentile marks. **, T levels in the testis were significantly higher than those in the other tissues (P < 0.05). *, T levels in the LNG were significantly higher than the levels in all other tissues examined, except for testis (P < 0.05).
(B). Correlation of LNG and OM T levels with serum T levels among the eight mice analyzed. Tissue and serum T levels for each mouse were plotted. The correlation coefficient (r) is 1.000 for LNG vs. serum (P < 0.001), and 0.952 for OM vs. serum (P <0.001), according to the Spearman rank order correlation test.

