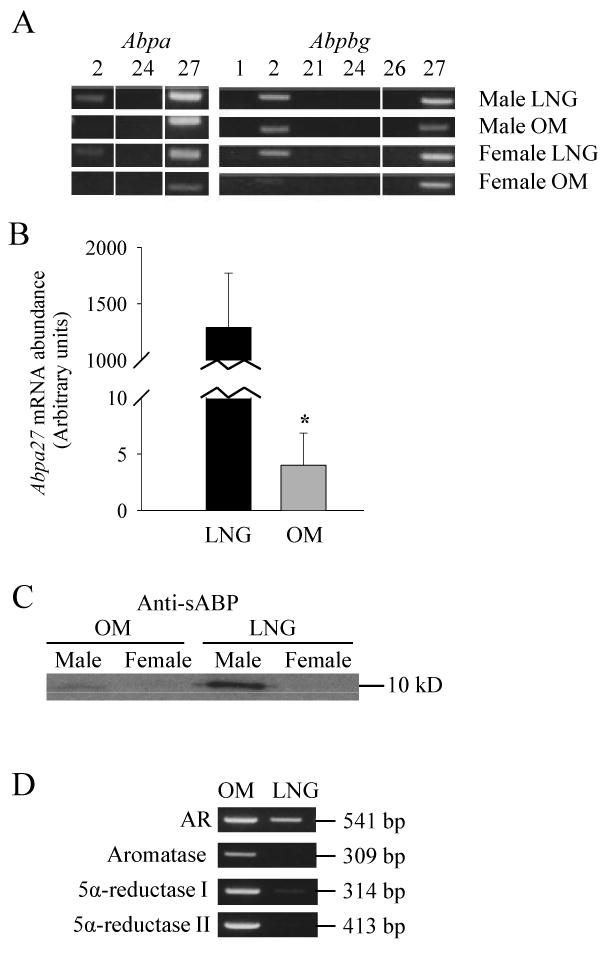
Fig. 2. Gene expression analysis for OM and LNG.

(A). Detection of various Abpa and Abpbg transcripts in the OM and LNG of male and female mice by RNA-PCR analysis. Tissues from 8- to 12-week-old mice (three per group) were pooled for total RNA preparation. PCR products were analyzed on 1% agarose gels, and visualized by staining with ethidium bromide. Numbers represent various Abpa or Abpbg transcripts. The results shown are representative of two independent determinations.
(B). Real-time RNA-PCR analysis of Abpa27 expression in the OM and LNG of male mice. The values shown represent means ± SD. *, There is a significant difference between OM (n=5) and LNG (n=4) (P < 0.01).
(C). Immunoblot analysis of sABP protein expression in the OM and LNG. Tissue homogenates from OM and LNG (30 μg protein each), pooled from three 8- to 12-week-old mice, were analyzed using a polyclonal anti-sABP antibody. The size of the sABP proteins detected is indicated. The results shown are representative of two independent determinations.
(D). RNA-PCR analysis of expression of androgen receptor (AR), aromatase, and 5α-reductase type I and type II in OM and LNG of male mice. The sizes of PCR products detected are indicated. Tissues from 8- to 12-week-old mice (three per group) were pooled for total RNA preparation. The results shown are representative of two independent determinations.
