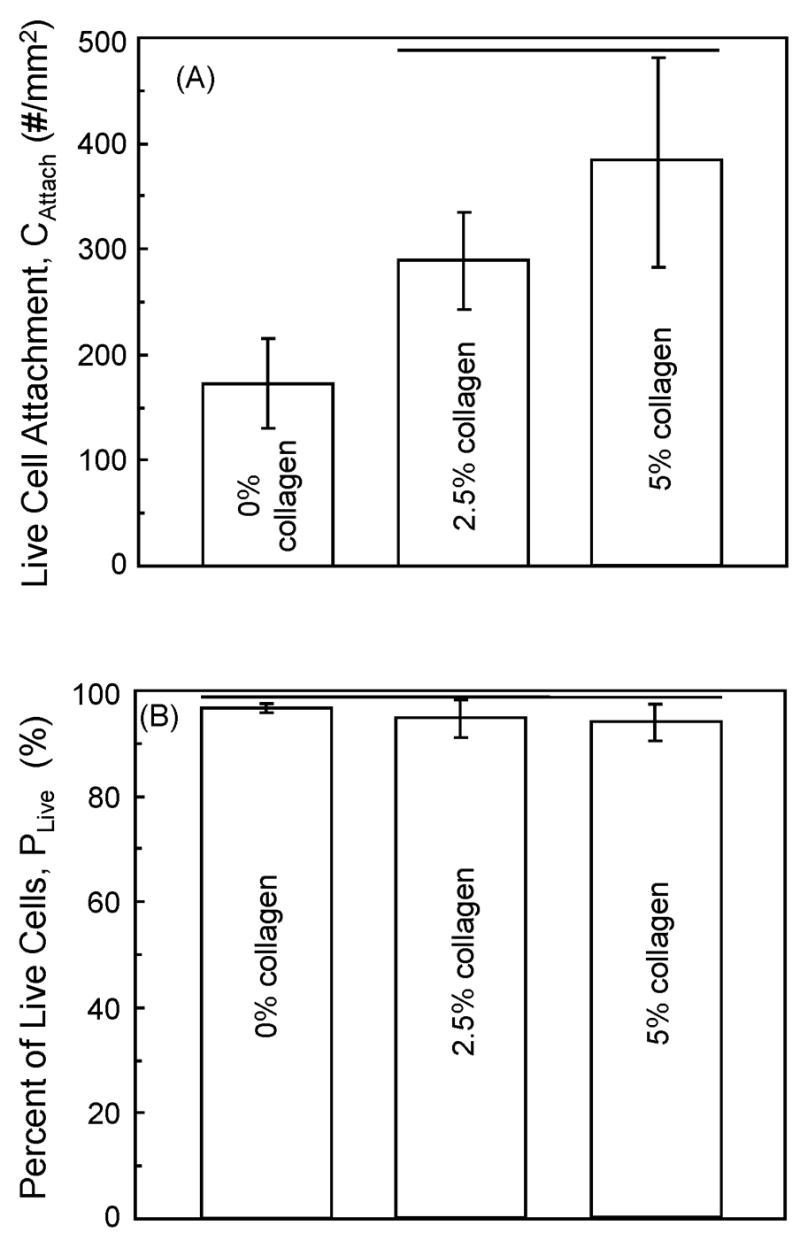
Figure 5.

(A) Live cell attachment = Number of live cells/mm2 of CPC specimen surface area (mean ± sd; n = 5). Horizontal lines indicate values that are not significantly different (Tukey’s multiple comparison test; family confidence coefficient = 0.95). (B) Live cell density = Number of live cells/(number of live cells + number of dead cells). Horizontal lines indicate values that are not significantly different (Tukey’s at 0.95).
