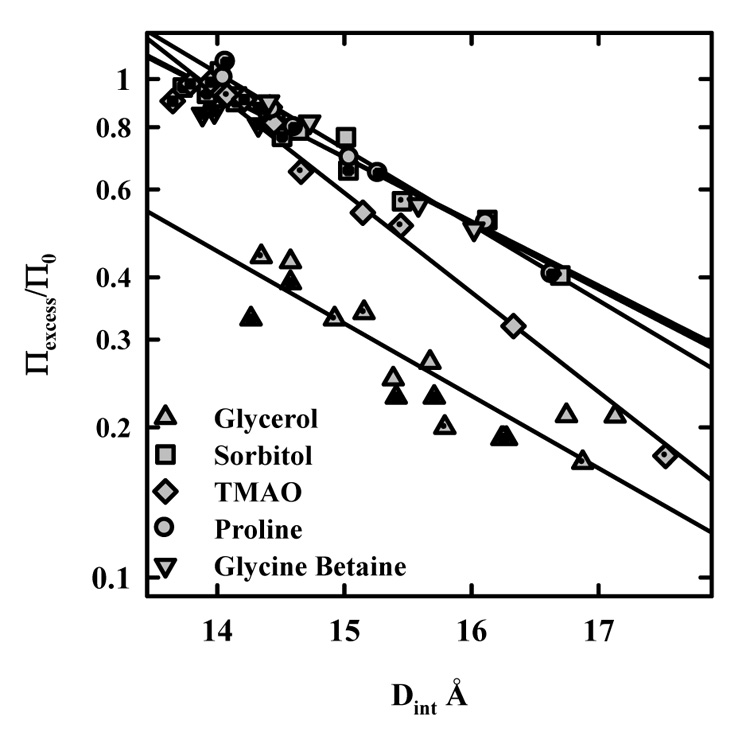
Figure 2.

The dependence of osmolyte exclusion on the distance between HPC chains. The excess osmotic pressure as indicated in figure 1 normalized by the osmolyte contribution to the solution osmotic pressure is shown as a function of the interaxial spacing for several protein stabilizing solutes at two or three concentrations. Πexcess/Π0 = 1 corresponds to complete exclusion, while Πexcess/Π0 = 0 indicates no preferential inclusion or exclusion. The overlap of the different concentrations indicates an osmotic effect, i.e., that ΔNw is constant at a fixed Dint over the concentration range examined. The exclusion curves for sorbitol, glycine betaine, and proline are virtually identical. Glycerol is excluded more weakly. TMAO has a somewhat different exponential decay length compared with the others. The solute concentrations examined are: 0.4 and 0.8 m glycine betaine; 0.4, 0.8, and 1.2 m glycerol; 0.25, .05, and 1 m sorbitol, 0.25, 0.5, and 1 m TMAO; and 0.25 and 0.5 m proline. Plain symbols are for the lowest solute concentration, followed by dotted and crossed symbols. The different concentrations for each osmolyte overlap within experimental error indicating an osmotic effect, i.e., Γw is constant at a fixed HPC interaxial spacing insensitive to osmolyte concentration.
