
Figure 5.
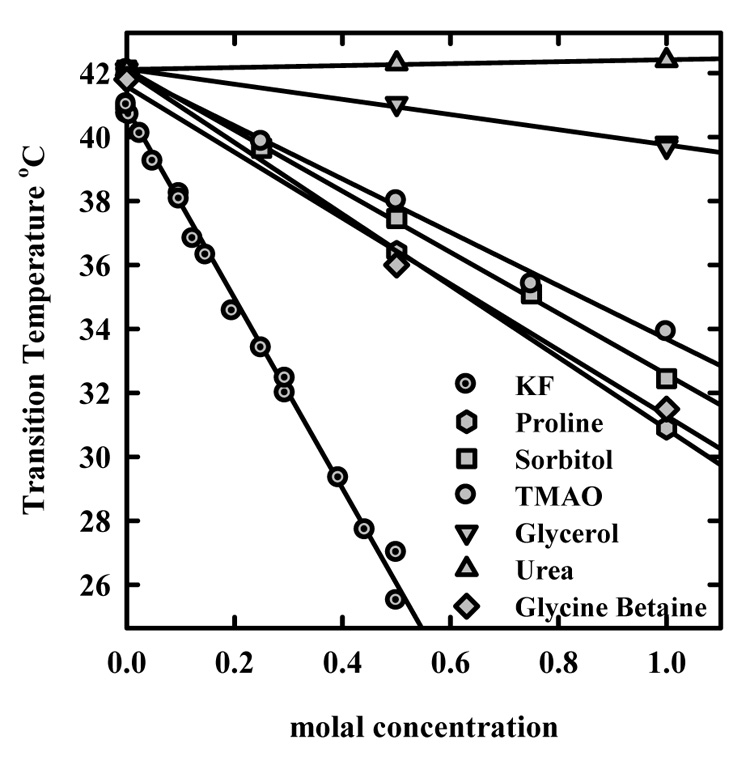
The dependence of the precipitation transition temperature on osmolyte concentration. The decrease in precipitation temperature with increasing concentration of the protein stabilizing osmolytes is consistent with exclusion. The slope depends both on the number of excess water molecules released and on the entropy change across the transition as indicated in equation (6).