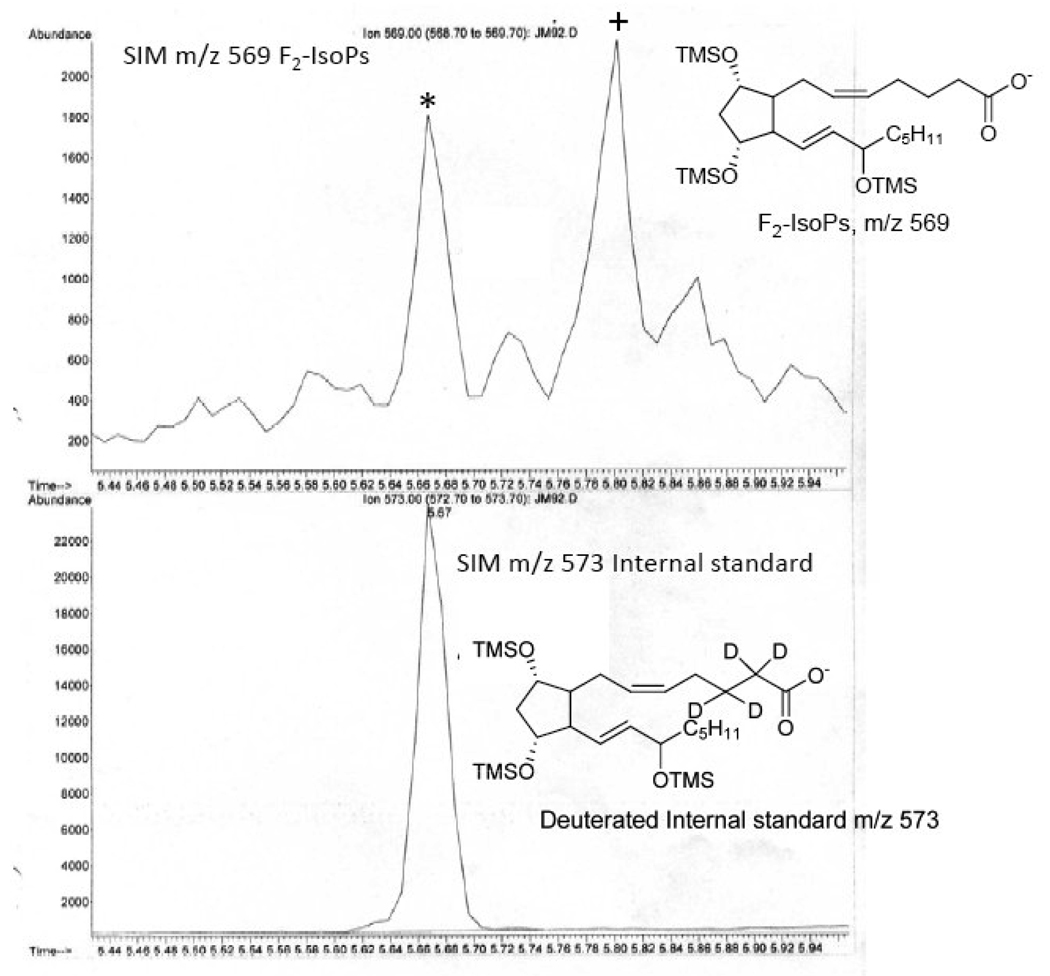
Figure 3.
Analysis of F2-IsoPs in liver obtained from a mouse. The m/z 573 ion current chromatogram represent the [2H4] 8-iso-PGF2a internal standard. The m/z 569 ion current chromatogram represents endogenous F2-IsoPs.The peak in the upper chromatogram represented by the star (*) is the one routinely used for quantification of the F2-IsoPs.The peak represented by the plus (+) can be comprised of both F2-IsoPs and COX-derived PGF2α.

