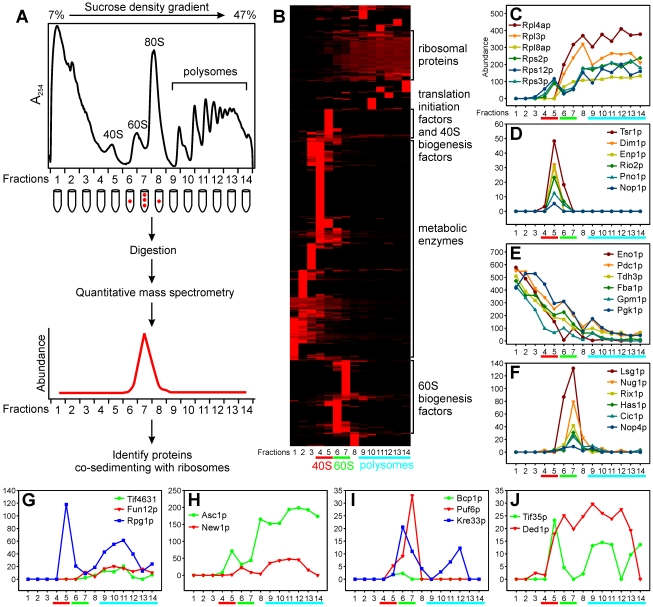
Figure 4. Co-sedimentation of candidate proteins with ribosomal subunits was independently verified using mass spectrometry.
(A) Schematic overview of the experimental design. (B) Hierarchical clustering of abundance profiles of 1,023 proteins (row) identified from fractions (columns) of the sucrose density gradient of wild-type yeast cells. Four distinct clusters are enriched (p<10−8; [83]) for r-proteins, translation-initiation factors and 40S biogenesis factors, metabolic enzymes, and 60S biogenesis factors. Representative profiles are plotted for r-proteins (C), 40S biogenesis factors (D), metabolic enzymes (E), and 60S biogenesis factors (F). (G–J) show profiles for several ribosome biogenesis candidates. Abundance in (C–J) is provided as the frequency of spectral counts (×10,000) of each protein in each fraction; abundance in (B) is further row-normalized.

