
Fig. 4.
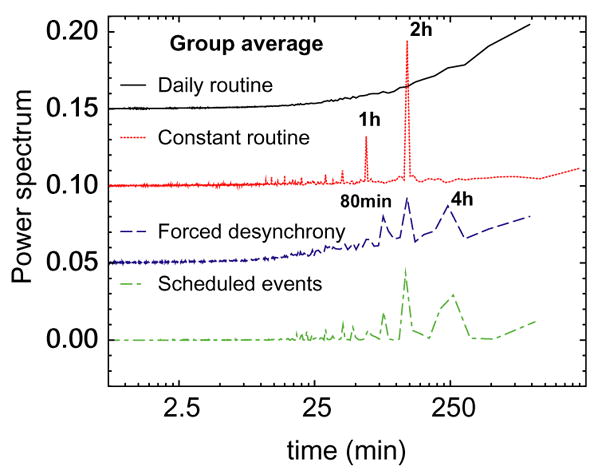
Group average power spectral densities for all three protocols. Curves are vertically offset. Power spectra are shown with decreasing frequency from left to right. Smooth behavior of the daily routine curve suggests absence of periodic rhythms in the ultradian range. The spectral density peaks for the simulated scheduled activity data representing controlled scheduled events during the protocol (bottom curve) match the peaks observed in the original human activity data recorded during the forced desynchrony protocol. Our analysis and simulation suggest that the observed peaks in the power spectrum are due to scheduled laboratory events and cannot be attributed to endogenous ultradian rhythms.