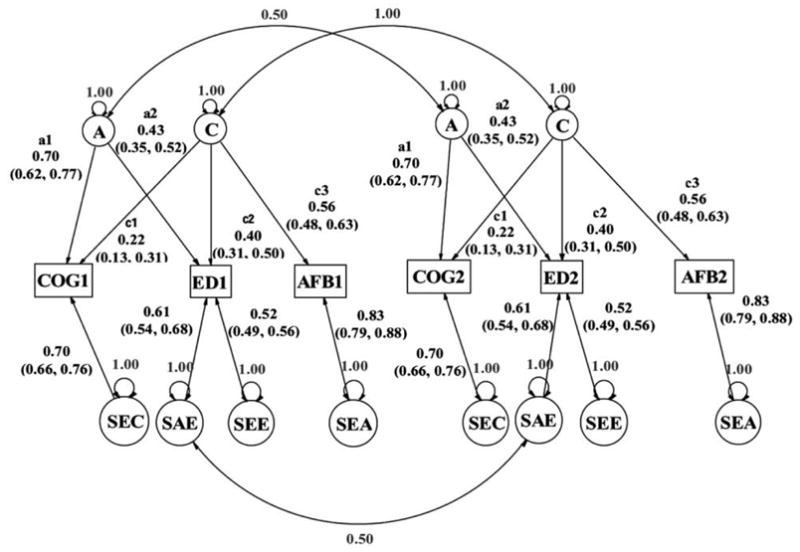
Fig. 3.

Best-fitting model from evaluation of the links in the model in fig. 2. Note that only the half of the model for DZ twin pairs is shown here; the MZ half of the model is constrained to have identical path coefficients. That model differs from this one only in that the two paths linking the latent A factors have a correlation of 1.0 instead of .5.
