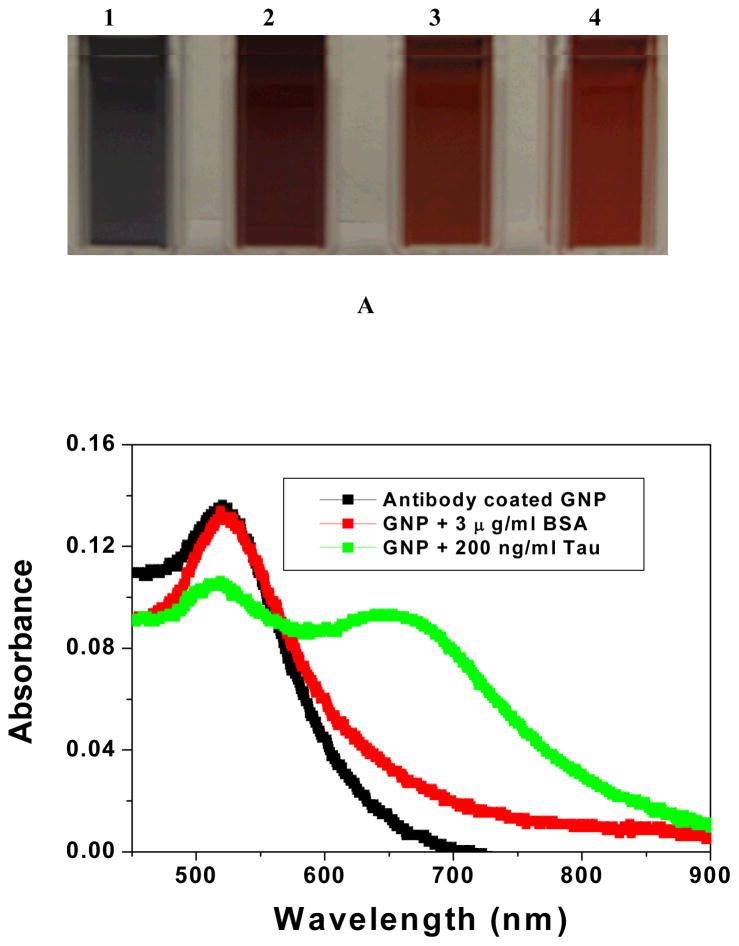
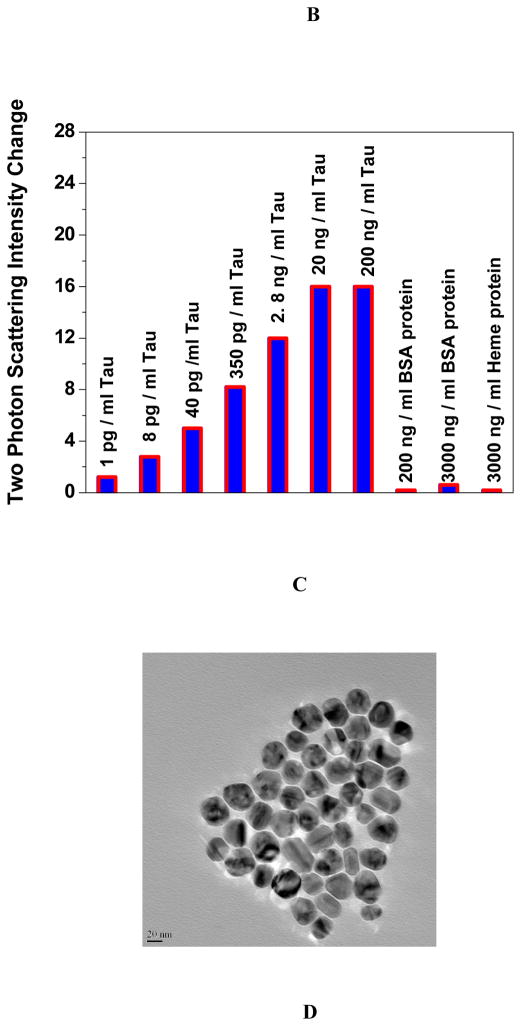
Figure 2.
A) Photograph showing colorimetric change upon addition of 1) 200 ng/ml Tau, 2) 2.8 ng/ml of Tau, 3) 3000 ng/ml BSA protein, 4) 800 mg/ml heme protein. B) Absorption profile variation of monoclonal ani-tau antibody conjugated gold nanoparticle due to the addition Tau protein (200 ng/ml Tau). The strong long wavelength band in the visible region (λPR = 520 nm) is due to the oscillation of the conduction band electrons. New band appearing around 670 nm, due to the addition of Tau protein, demonstrates the aggregation of gold nanoparticles. C) Plot demonstrating two-photon scattering intensity changes (by 16 times) due to the addition of Tau protein to ani-tau antibody conjugated gold nanoparticle. Two-photon scattering intensity changes very little upon addition of BSA and heme protein. D) TEM image after addition of 800 ng/ml BSA protein, E) TEM image demonstrating aggregation of ani-tau antibody conjugated gold nanoparticle after the addition of 350 pg/ml Tau.


