
Figure 5.
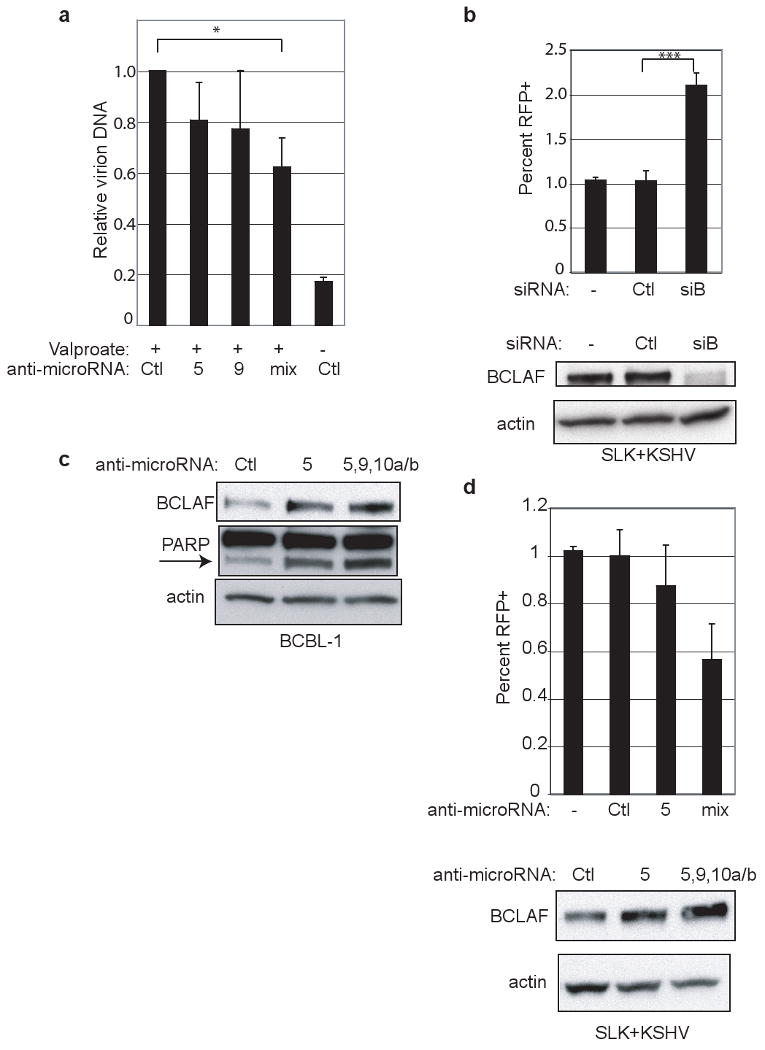
Inhibition of miRNAs and BCLAF1 expression. a, BCBL-1 cells were treated with miRNA inhibitors (“mix” is inhibitors for miR-K5, -9, -10a, -10b) followed by lytic induction by valproate treatment. Virions were purified from filtered supernatants. DNA content was measured by qPCR and normalized to a spike-in control. Values reflect average from three experiments with errors bars showing 1 std. dev. “*” refers to p-value less than 0.05. b, SLK endothelial cells expressing a recombinant virus with RFP under the control of a lytic promoter were transfected with no (-), control siRNA (Ctl), or BCLAF1 siRNA (siB). Cells were analyzed by flow for expression of RFP as a reporter of lytic induction. Values reflect average from at least six experiments with errors bars showing 1 std. dev. “***” refers to p-value less than 0.0001. Bottom panel shows western blot analysis from samples used for flow cytometry. c, Western blot analysis of BCBL-1 cells were treated with miRNA inhibitors and harvested five days after treatment. This is from the same experiment in Fig 3e with additional probing for PARP. Arrow indicates PARP cleavage product. d, Same cell line as in b were treated with miRNA inhibitors as in a and analyzed by flow cytometry. Western blot analysis shows endogenous BCLAF1 expression.