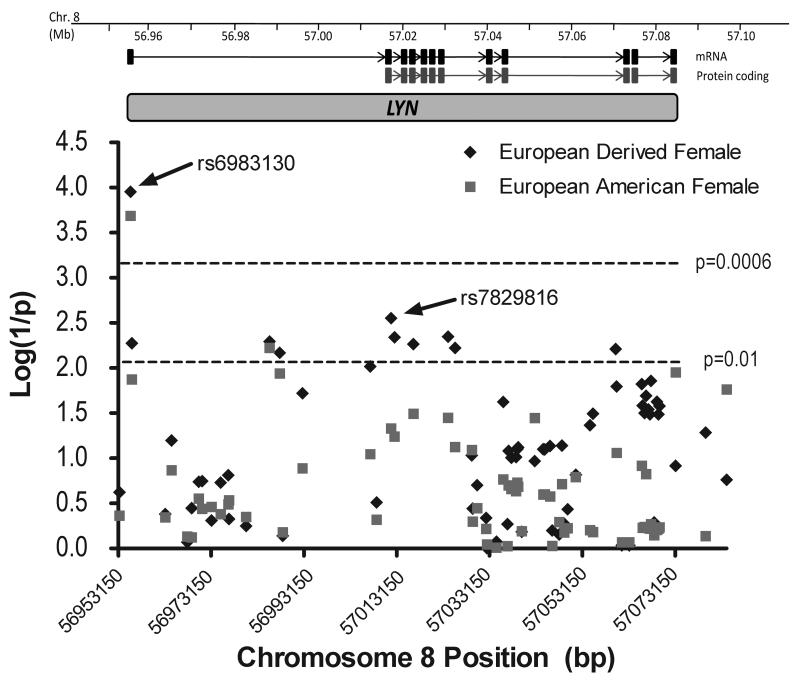
Figure 1.
Combined case-control association analysis results. Chromosome 8 genomic organization with LYN mRNA and protein coding exon positions are indicated. The graph depicts the association results, represented as log(1/P-value), for the maximal # of independent cases and controls in the various subsets as indicated. All association data for all populations are presented in Supplementary Table 2i online.

