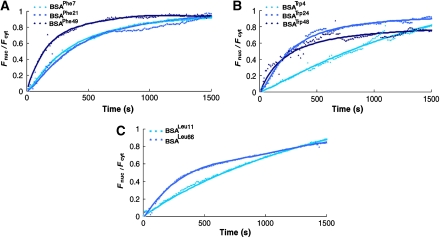
Figure 3.
Nuclear accumulation versus time traces of modified BSA. Shown are traces of BSA modified by (A) phenylalanine, (B) tryptophan, or (C) leucine analogues to varying degrees. Each data point represents the average obtained from multiple traces (see Figure 4C, for exact numbers) that were normalized before averaging. For convenience of presentation, error bars were not included (but see Figures 4A and 4C). The fits shown (solid lines) are provided only as guidance to the eyes.

