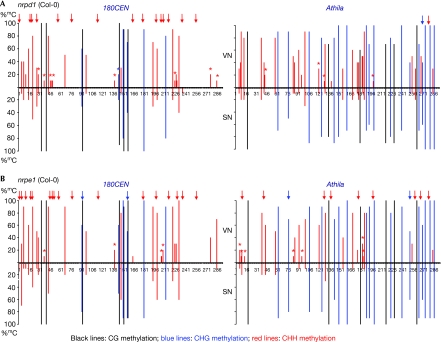
Figure 4.
Bisulphite sequencing analysis of cytosine methylation in nrpd1 and nrpe1 lines. The graphs show the percentage of methylation (%mC) at individual cytosines in cloned 180CEN (left) and Athila (right) sequences from sorted vegetative (top) and sperm (bottom) nuclei of (A) nrpd1 and (B) nrpe1 pollen. Black lines, CG methylation; blue lines, CHG methylation; and red lines, CHH methylation. Red and blue arrows above the methylation lines indicate the CHH and CHG sites, respectively, at which hypermethylation is lost in mutant VN compared with wild-type VN. Red and blue asterisks mark the CHH and CHG sites, respectively, showing more than a 50% reduction in %mC in mutant VN compared with wild-type VN. The results are from 10 cloned sequences for both mutants. Original data are shown in supplementary Fig S4 online. nrpd1, nuclear rna polymerase 4 subunit 1; nrpe1, nuclear rna polymerase 5 subunit 1; SN, sperm nuclei; VN, vegetative nuclei.

