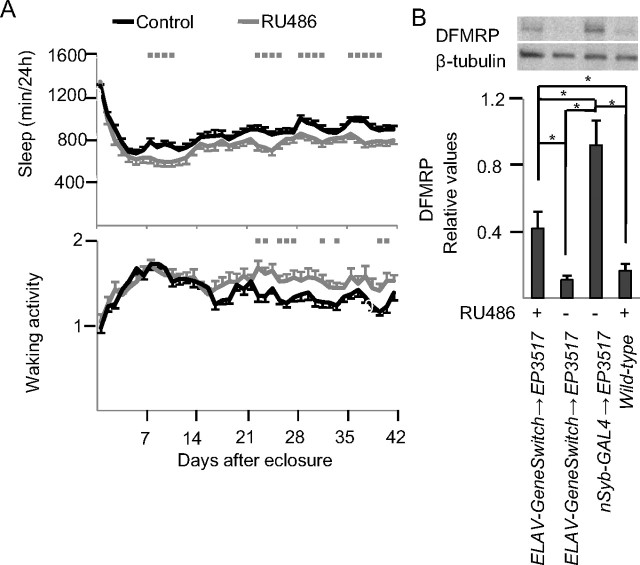
Figure 9.
Sleep effects of dFmr1 overexpression in the adult. A, Daily sleep amount and waking activity from eclosure to day 42 and average values for the entire 42 d period. All flies shared the same genotype (w1118; ELAV-GeneSwitch/EP3517), but their food contained either vehicle (control) or RU486. Gray squares (in A) indicate significant difference from controls (p < 0.05, Mann–Whitney test). Number of flies for day 1 and day 42 were as follows: RU486 = 26/24, Control = 36/29. B, Western blot analysis using an antibody that binds DFMRP (β-tubulin was used as loading control).

