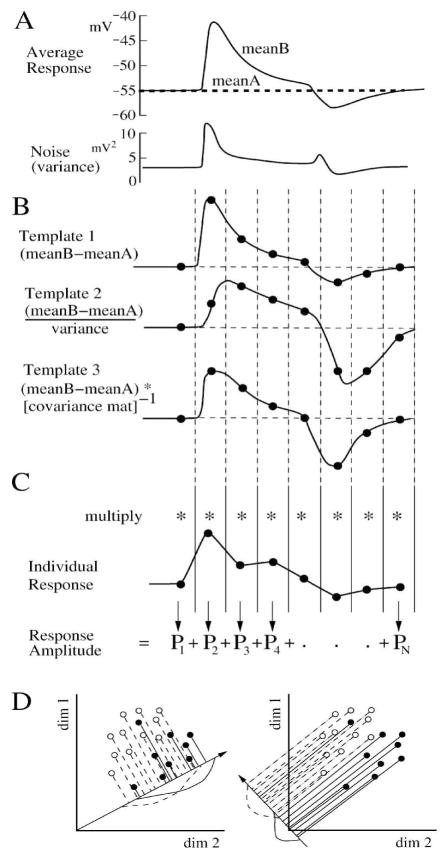
Figure 5.
Discriminant templates for dimensional reduction. (A) Average response and noise from Figure 4A (25% contrast) as a function of time. (B) Three linear templates which take into account progressively more statistical detail from the responses. The templates are constructed from the difference between the average responses. (C) Individual responses are multiplied bin-for-bin by one of the templates, and the products (Pn) are summed to give the ideal filtered response amplitude. (D) Geometrically, the template is a vector that sets a projection angle for each dimension (bin). It optimally projects the multidimensional responses onto one dimension to maximize SNR. The two figures show the same 2 sets of 2D points, showing dimensional reduction and projection onto lines pointing in different directions. The directions of the lines are defined by the templates. The points are correlated in the two dimensions, and most projections do not separate them (left, overlapping curves), but Fisher LDA optimally separates them in the projection at right. After Duda et al., (2001).

