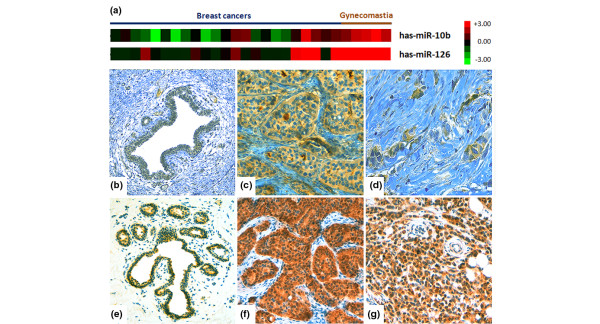
Figure 3.
miR-10b and miR126 genes are downregulated in male breast cancers versus gynecomastia. (a) Columns represent individual tissue samples. Pseudocolors indicate transcript levels below, equal to, or above the mean (green, black, and red, respectively). The scale represents the intensity of gene expression (log2 scale ranges between -3 and 3). Representative examples of (b), (c), (d) homeobox-D10 and (e), (f), (g) vascular endothelial growth factor immunohistochemical expression in male breast cancers and gynecomastia samples. (b) and (e) Weak immunohistochemical staining in gynecomastia samples. (c), (d), (f) and (g) Positive immunoreactions in male breast cancer samples.

