
Figure 2.
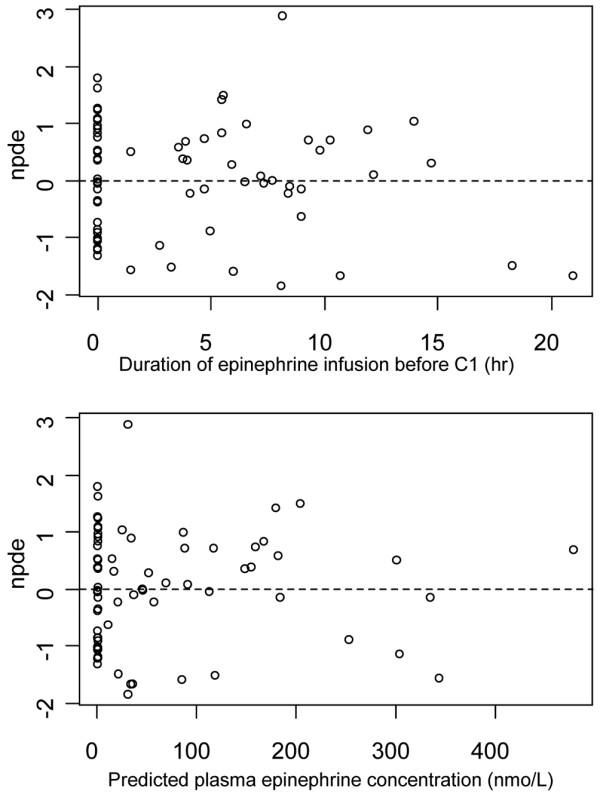
Goodness-of-fit plot for the final model, normalized prediction distribution errors. The upper frame shows normalized prediction distribution errors (npde) vs. duration of epinephrine perfusion (delay C0 to C1) and the lower frame npde vs. model-predicted concentrations. The npde distribution was not significantly different from normality (P = 0.10 by Shapiro-Wilks test). Npde statistics are based on estimates of unbiased means and variances of the observations using 500 Monte Carlo simulations of the final model (the calculations include a de-correlation step of the prediction errors).