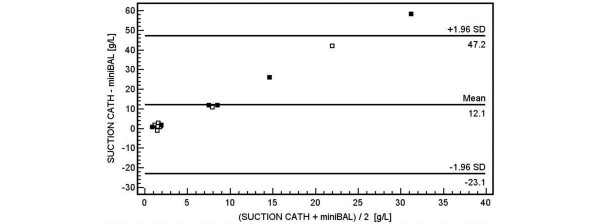
Figure 4.
Bland-Altman analysis of agreement showing the differences between protein content (g/L) measurements plotted against the average between methods. Squares correspond to patients. The middle horizontal line indicates the average difference between the two methods (12.1 g/L), whereas the outer lines represent the upper and lower limits of agreement. The black squares represents patients with acute cardiogenic lung oedema.

