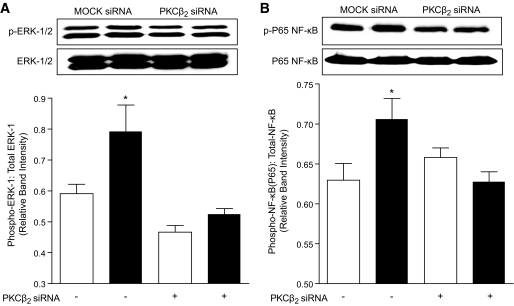
FIG. 6.
Effect of PKCβ2 silencing on ERK1/2 and NF-κB activation in VSMC. A: Representative Western blot showing phospho-ERK-1 (Thr202) and phospho-ERK-2 (Tyr204) in comparison with total ERK1/2 in VSMC treated with MOCK or PKCβ2 siRNA. The densitometric values of phospho-ERK-1 were normalized to corresponding total ERK-1 densitometric values, and the relative band intensities are expressed as means ± SE (n = 4 independent experiments). Open bars represent low glucose–treated and dark bars represent high glucose–treated VSMC. *P < 0.05 compared with all other groups. B: Representative Western blot showing phospho-NF-κB P65 subunit (Ser536) in comparison with total NF-κB P65 in VSMC treated with MOCK or PKCβ2 siRNA. The densitometric values of phospho-NF-κB P65 were normalized to corresponding total NF-κB P65 densitometric values and the relative band intensities are expressed as means ± SE (n = 4 independent experiments). Open bars represent low glucose–treated and dark bars represent high glucose–treated VSMC. *P < 0.05 compared with all other groups.

