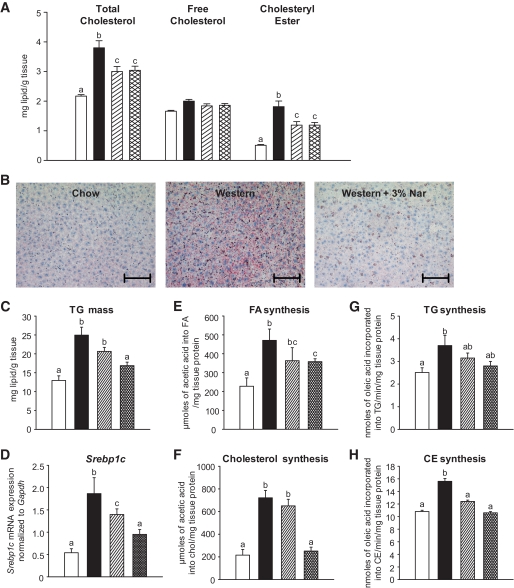
FIG. 3.
Liver lipid metabolism and gene expression in naringenin-treated mice. Ldlr−/− mice (n = 12/group) were fed a standard diet or a high-fat diet alone or supplemented with naringenin (1 or 3%) for 4 weeks. A: Cholesterol concentrations in liver extracts. B: Oil Red O and hematoxylin-stained sections of liver. Representative photomicrographs. Scale bar = 100 μm. C: Triglyceride concentrations in liver extracts. D: Expression of Srebp1c relative to Gapdh in liver by qRT-PCR. E and F: Hepatic synthesis of fatty acid and cholesterol in liver (n = 5–7/group) obtained 60 min postinjection intraperitoneally with [14C]acetic acid. G and H: Hepatic synthesis of triglyceride and cholesteryl ester in liver homogenates using [14C]oleoyl-CoA (n = 6/group). □, standard diet; ■, Western diet; ▨, Western diet and 1% naringenin; ▩, Western diet and 3% naringenin. Values are means ± SE, different letters are statistically different, P < 0.05. (A high-quality digital representation of this figure is available in the online issue.)

