FIG. 6.
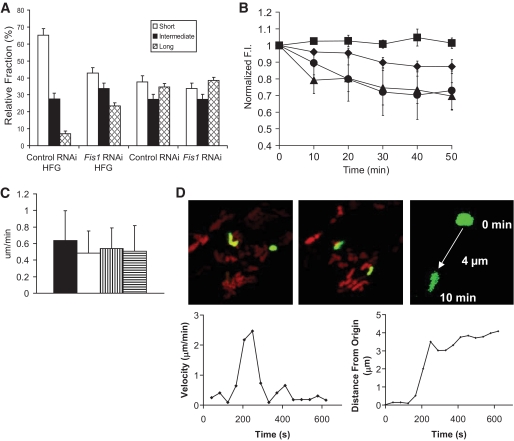
Fis1 RNAi restores mitochondrial morphology and dynamics under HFG in INS1 cells. A: Mitochondrial morphometry. Mitochondria were classified according to AR into short (AR <2), intermediate, (2<AR<4), and long (AR >4) length (n = 8 cells per group). B: Whole-cell mitochondrial fusion assays (PAGFPmt dilution) in Fis1 RNAi INS1 cells exposed to HFG for 24 h (▲). A hyperbolic fitting yielded T50 = 7.6 min. Fis1 RNAi cells not exposed to HFG are also plotted (♦). Values of control RNAi cells with and without HFG treatment were imported from Fig. 3C (■ and ○, respectively). C: Mitochondrial movement was calculated by measuring the velocity of single mitochondria over time. Velocities are not significantly different between groups (P >0.05). Control RNAi with and without HFG treatment are represented by ■ and □, respectively. Fis1 RNAi cells with and without HFG treatment are represented by  and ▤, respectively. D: Confocal images demonstrating mitochondrial movement analysis. Images at time 0 and 10 min are portrayed. The last image zooms to one mitochondrion and the movement over 10 min is depicted, in this case 4 μm over 10 min. The velocity over time is plotted and indicates a peak around 250 s. When the distance from the origin is plotted over time, it is evident that mitochondria do not move at a constant speed. (A high-quality digital representation of this figure is available in the online issue.)

