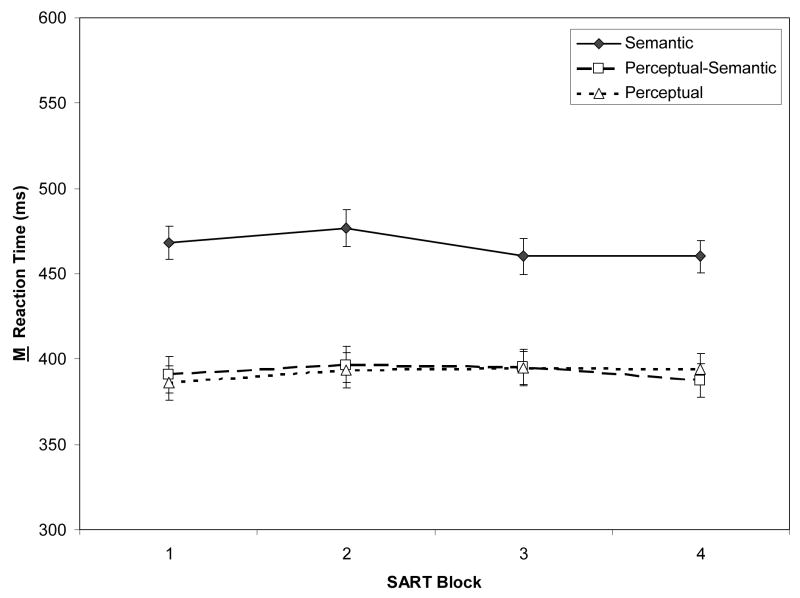
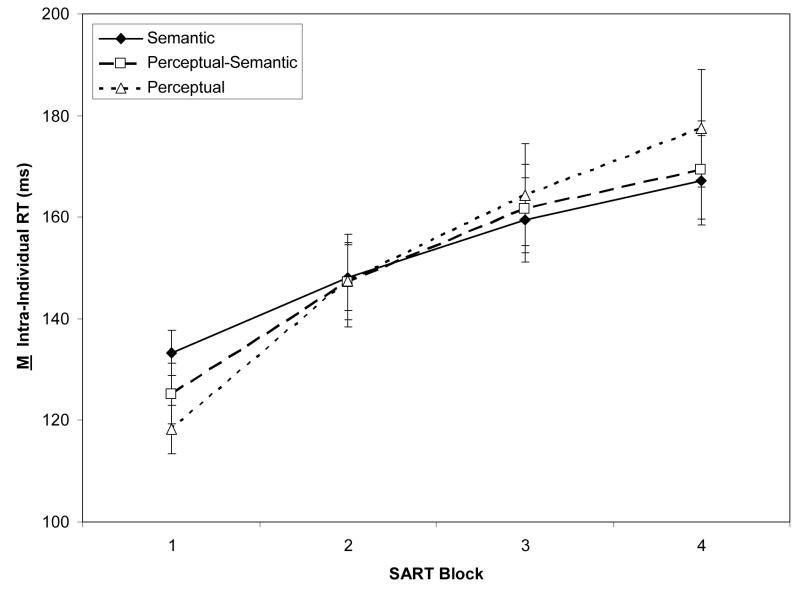
Figure 2.
Response time (RT) measures from the Semantic, Perceptual-Semantic, and Perceptual SARTs (Sustained Attention to Response Tasks), across task blocks (N = 243). Panel A: Means of individual subjects’ mean RTs. Panel B: Means of individual subjects’ RT standard deviations. Error bars represent standard errors.


