
Figure 2.
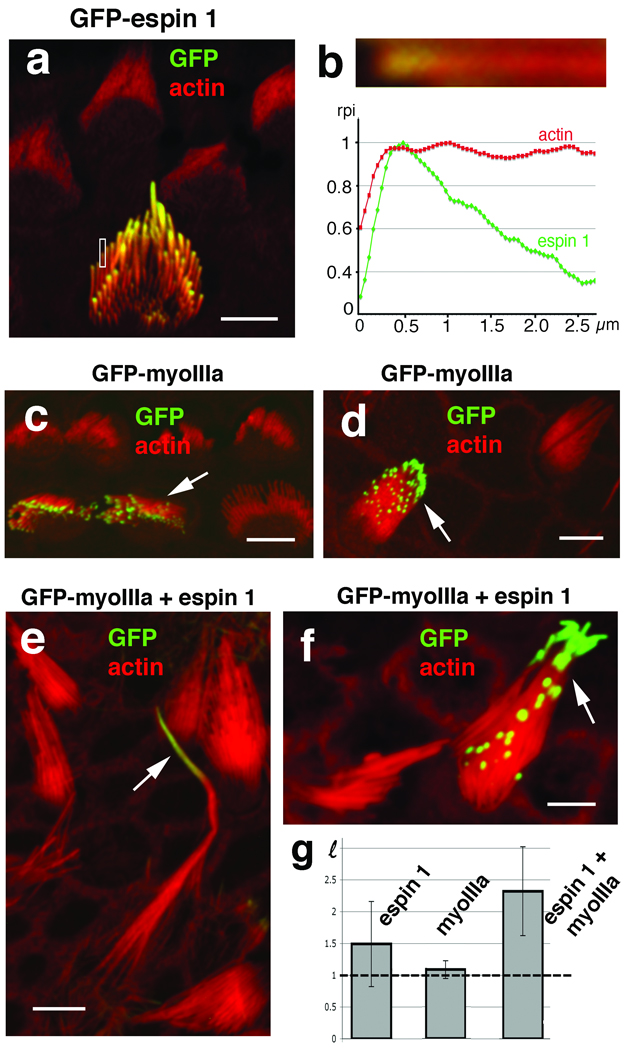
Espin 1 alone or when co-overexpressed with myosin IIIa elongates stereocilia. (a) GFP-espin 1 localizes to stereocilia tips in a tip-to-base gradient distribution in transfected cultured organ of Corti hair cells. (b) High magnification close-up view and measurement of the relative pixel intensity (rpi) of GFP-espin 1 (green) and actin (Alexa 568-phalloidin, red) fluorescence along the distal portion of the stereocilia shown in the rectangular inset in (a) matches the tip-to-base concentration gradient observed for endogenous espin 1 (Fig. 1h). Organ of Corti (c) and vestibular (d) hair cells transfected with GFP-myosin IIIa show tip localization similar to espin 1. Co-transfection of vestibular hair cells with GFP-myoIIIa (arrow, green) and untagged espin 1 together (e and f) produce longer stereocilia than hair cells transfected with GFP-espin 1 alone (a) or with GFP-myosin IIIa alone (c and d). The average ratios of stereocilia length between transfected (HT) and neighboring non-transfected (HNT) cells, , are plotted in the bar graph in (g). GFP-espin 1 alone = 1.5 ± 0.67, n=19 (∼50% increase); GFP-myoIIIa alone = 1.1 ± 0.14, n=16 (∼10% increase); and GFP-myosin IIIa and espin 1 = 2.3 ± 0.69, n=14, (∼130% increase). Note that a value of ℓ=1 (indicated by the dotted line in the graph) corresponds to a zero percent increase in length. The error bars represent the standard deviation of the mean. ANOVA statistical analysis shows that the mean value for the hair cells co-transfected with espin1 and myosin IIIa is significantly higher than the cells transfected with espin 1 alone, with a p-value equal to 0.002. In contrast, the mean bundle heights for hair cells transfected with myosin IIIa alone were not significantly higher than the controls, with a p-value of .149. Scale bars, 5 µm.