
Figure 5.
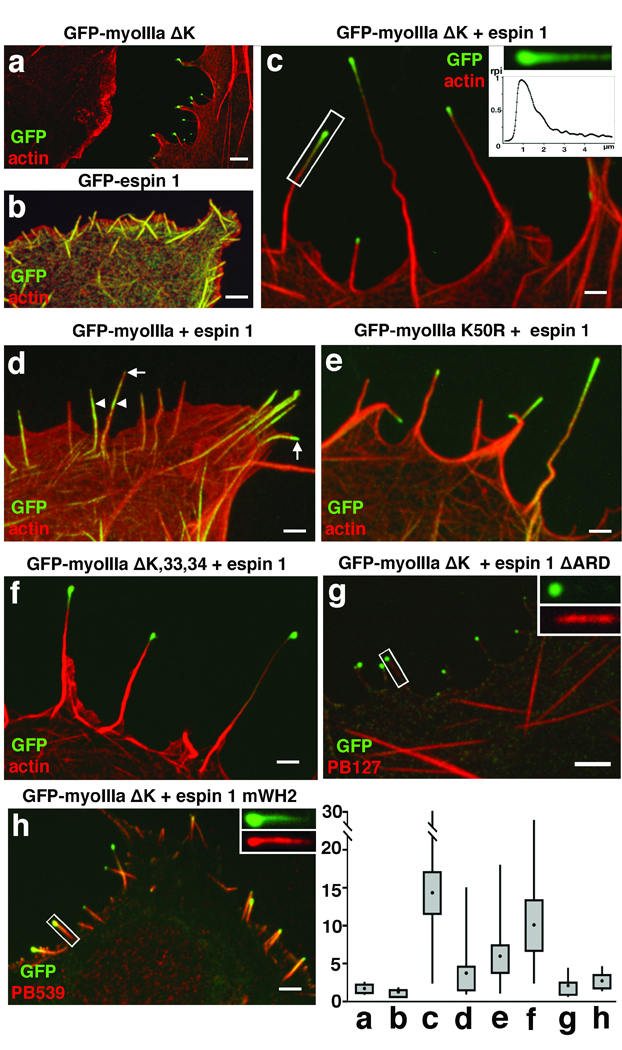
Myosin IIIa and espin 1 synergistically elongate filopodia in COS-7 cells via espin 1 WH2 activity. Overexpression of either GFP-myoIIIa ΔK (a) or GFP-espin 1 (b) results in formation of short filopodia (mean lengths = 1.7 ± 0.83 µm and 1.3 ± 0.28 µm, respectively). In contrast, the co-expression of GFP-myoIIIa ΔK (green) and espin 1 (c) has a synergistic effect that generates extremely long filopodia (14.3 ± 9.1 µm). F-actin (red) is visualized using Alexa 568-phalloidin. (inset, c) Graph of the relative pixel intensity (rpi) of the GFP-myoIIIa ΔK distribution in the single filopodium indicated by the rectangle in c shows the characteristic tip-to-base decaying gradient. (d) Co-expression of full length GFP-myoIIIa and espin 1 produces a more limited tip localization of these proteins and elongation of filopodia (3.7 ± 3.2 µm) when compared to co-expression of GFP-myoIIIa ΔK and espin 1. (e) The enhanced elongated phenotype is restored to a limited extent (5.93 ± 3.10 µm) when COS-7 cells were co-transfected instead with GFP-myoIIIa K50R and espin 1. (f) The enhanced elongation phenotype is similar to c when the cell was co-transfected with GFP-myoIIIa ΔK,33,34 and espin 1 (10.02 ± 4.7 µm). (g) Co-expression of GFP-myoIIIa ΔK and espin 1 lacking ARD (espin 1 ΔARD, labeled with the pan espin antibody, red) but fails to elongate filopodia (2.05 ± 1.8 µm) and to show tip localization of espin 1 ΔARD (inset, g). (h) Co-expression of GFP-myoIIIa ΔK and espin 1 with a mutated WH2 domain (espin 1 mWH2, labeled with espin 1 antibody, red) fails to elongate filopodia (2.65 ± 1.5 µm) despite the fact that espin 1 mWH2 localizes to the tip and forms the tip to base gradient matching the distribution of the GFP-myoIIIa ΔK (inset, h). Scale bars, 2.5 µm. Measurements of filopodia lengths for each of the combinations shown in the panels above are presented as box-plots, with upper and lower whiskers representing the range, the top and bottom of the box representing the upper and lower 25th percentile, and the filled squares represent the mean values.