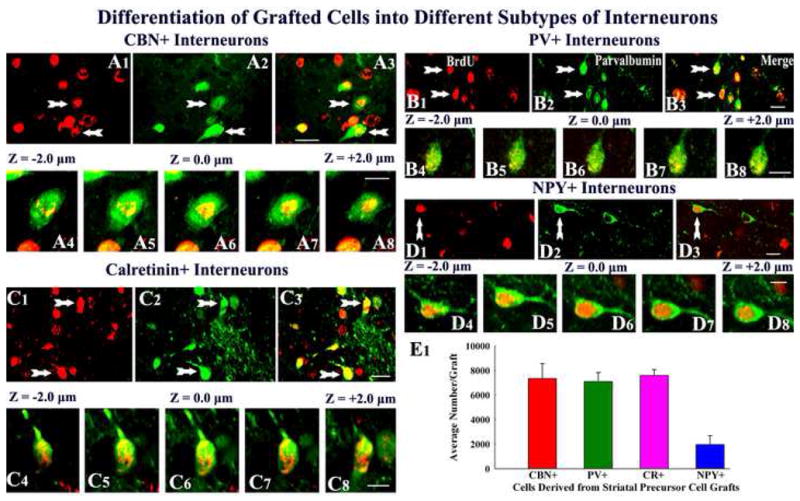
Figure 6.

Differentiation of grafted striatal precursor cells into subclasses of gamma-amino butyric acid (GABA) positive neurons, visualized through dual immunofluorescence and confocal microscopy. The figures show examples of 5′-bromodeoxyuridine (BrdU) positive grafted cells that differentiate into interneurons positive for calbindin (A1–A3), parvalbumin (PV, B1–B3), calretinin (C1–C3) and neuropeptide Y (NPY, D1–D3). Figures A4–A8, B4–B8, C4–C8 and D4–D8 illustrate Z-section analyses of grafted cells that are positive BrdU & calbindin, BrdU & parvalbumin, BrdU & calretinin, and BrdU & neuropeptide Y respectively. The bar chart in E1 depicts average numbers of interneurons positive for calbindin, parvalbumin, calretinin and neuropeptide Y in individual striatal precursor cell grafts. Scale bar, A1–A3, B1–B3, C1–C3, D1–D3 = 10μm; A4–A8, B4–B8, C4–C8, D4–D8 = 5μm. CBN, calbindin, PV, parvalbumin, CR, calretinin, and NPY, neuropeptide Y.
