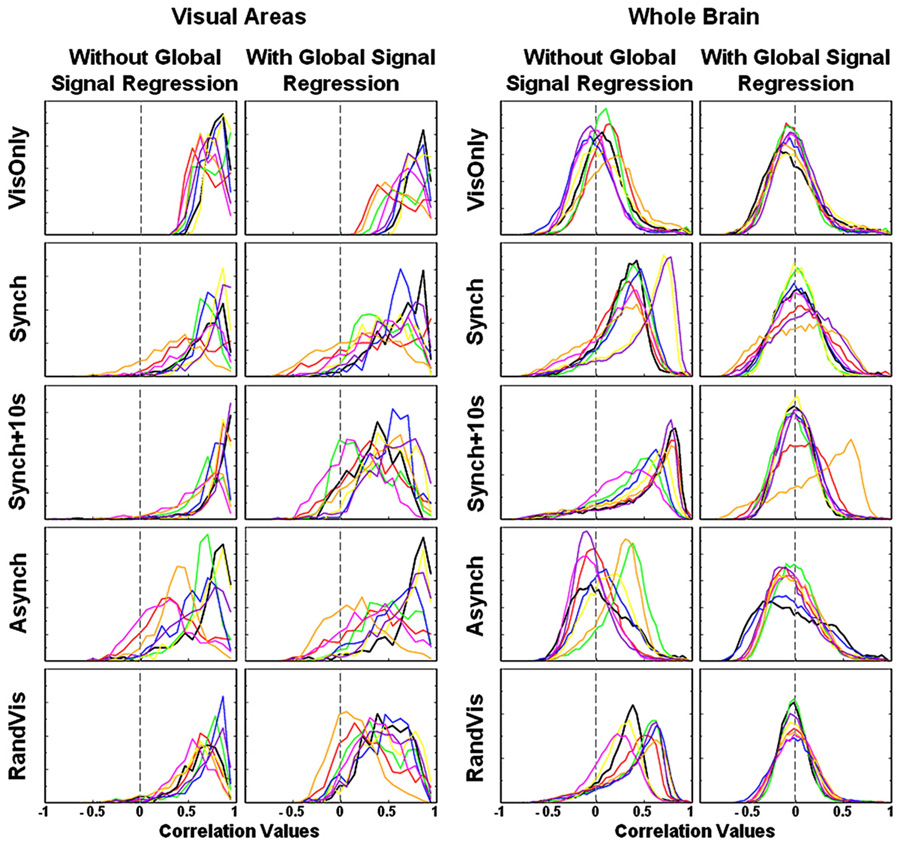
Fig. 4.
The distributions of correlation values in the seed region correlation analyses are shown with each subject represented by a different colour. Each of the five rows displays one of the five breath holding and visual task conditions. Distributions drawn from only the visual cortex are displayed on the left with whole brain distributions on the right, for data with and without global signal regression. The distributions from the visual areas show that global signal regression is not revealing underlying neuronally-related BOLD signal changes as we would like it to. Distributions in the visual cortex are broadened instead of sharpened by this technique and negative correlations are introduced. The whole brain distributions on the right demonstrate that global signal regression forces a bell-shaped curve, centred on zero, regardless of the relative phase of global and “resting state” changes.

