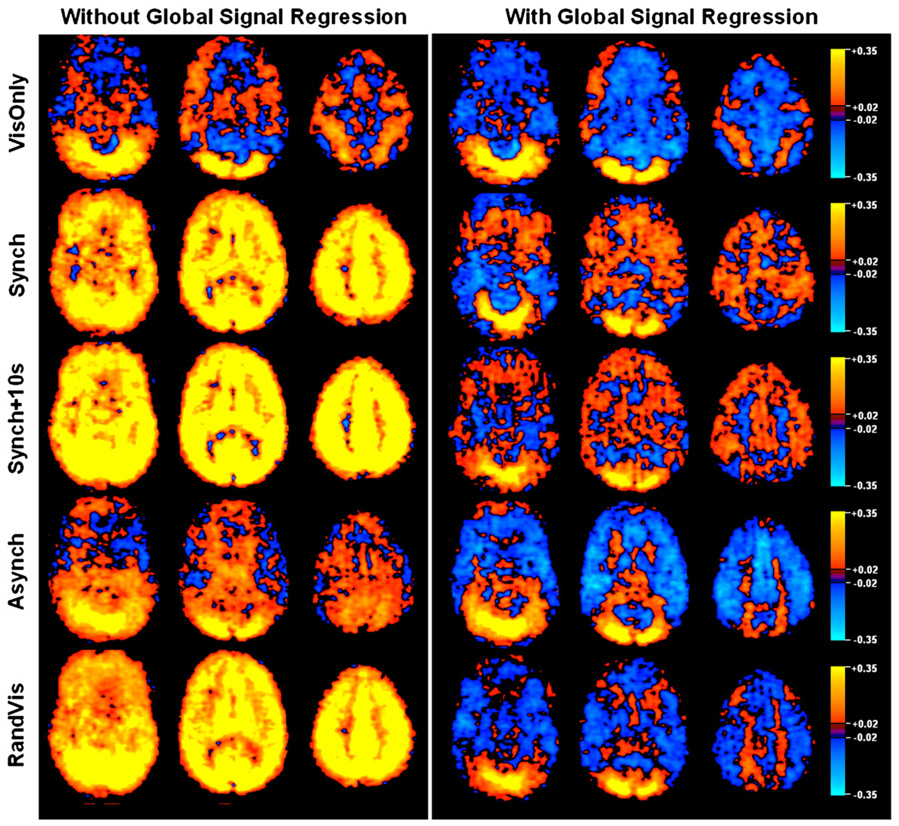
Fig. 5.
Three axial slices of correlations with the PCC region averaged across subjects are shown for each of the Breath Holding and Visual Task conditions. Without global signal regression, correlation values can be high across the entire brain. The Asynch condition shows that this is not the case when global signal and “resting-state” fluctuations are out of phase. If global signal regression performed the intended correction, one would expect all resulting maps to be similar. Large variation exists in the pattern of activated and deactivated regions across the conditions.

