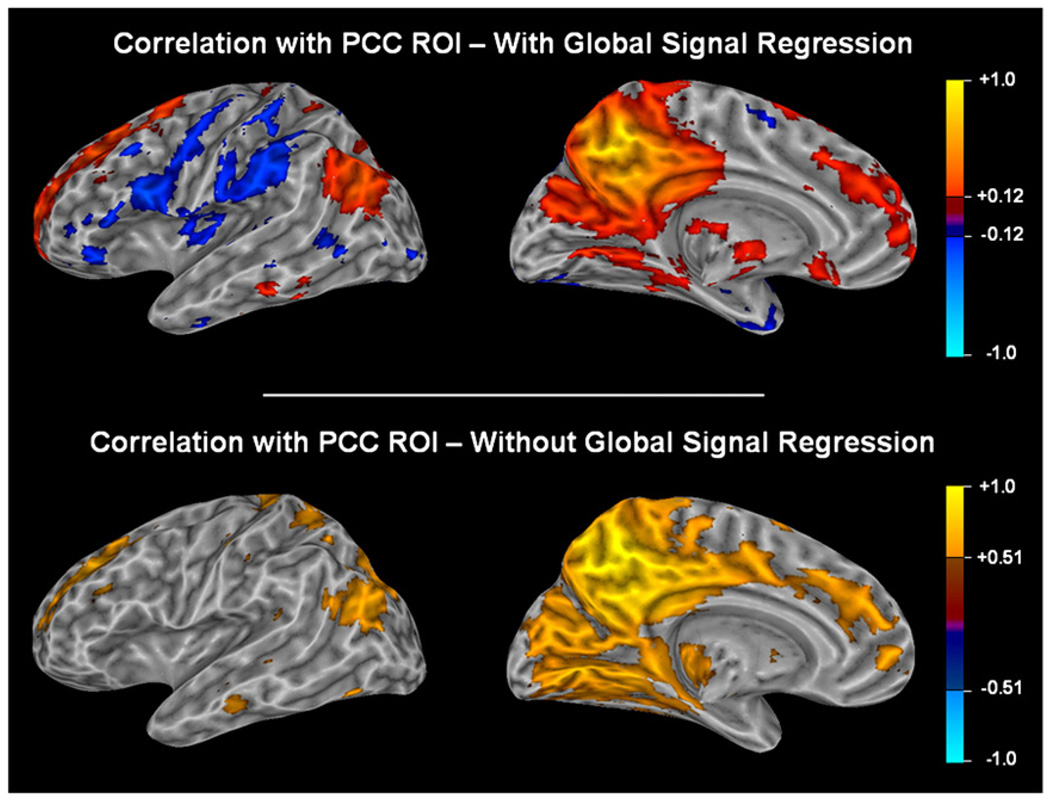
Fig. 6.
Correlations to a seed region in the PCC averaged across all subjects using a Fisher transform are shown with and without correction for the global signal. The task-positive network is visible only after global signal regression. Since global signal regression changes the distribution of correlation values (see Fig. 8), it would be incorrect to use the same threshold for both maps. To enable a fair comparison, we chose a correlation value such that all voxels that positively correlate to the PCC and that passed threshold would comprise 15% of the total number of voxels. Using these thresholds, the default mode network is visible both with and without global signal regression, but negatively correlated voxels are only visible after the global correction. Fig. 7 and the distributions in Fig. 8 demonstrate that lowering the threshold in the map that retains the global signal would not reveal negatively correlated voxels in the task-positive network.

