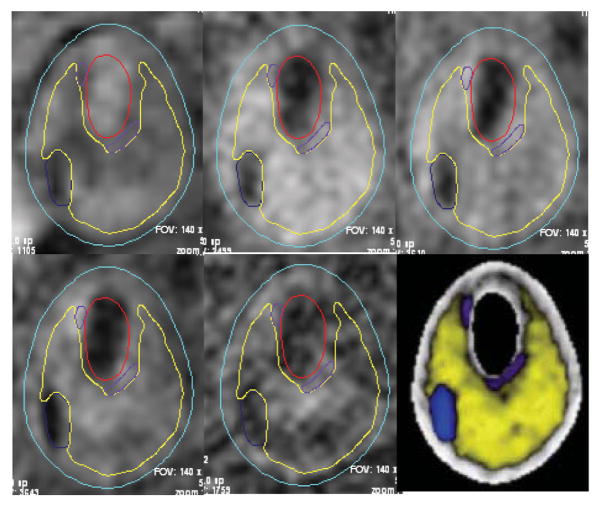
Figure 1.
The CASCADE interface permits multiple contrast weighting display, interactive delineation of plaque features, and concise reporting of quantitative lesion indexes among other functions. Contour plots of plaque components shown were generated by CASCADE and digitized for 3D geometry reconstruction. Five different contrast weighting are shown. The lower right figure is the segmented plaque with different plaque components identified.

