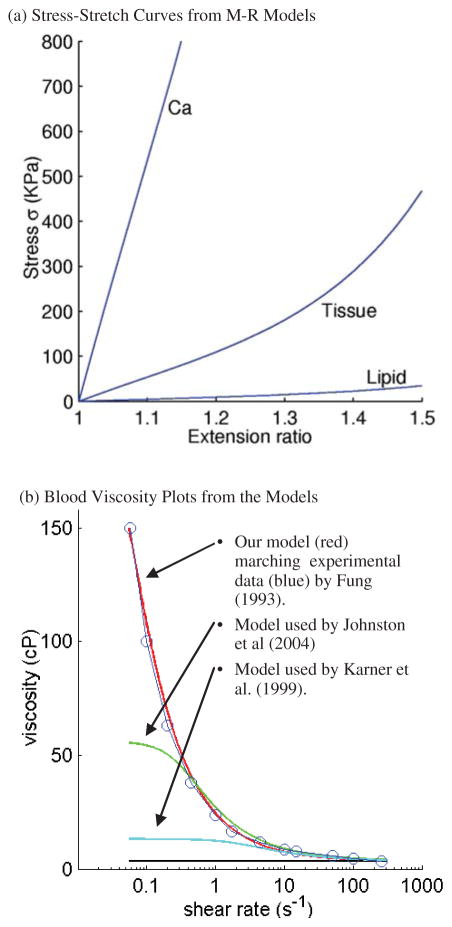
Figure 3.
(a) Stress-stretch curves derived from the modified Mooney-Rivlin models for fibrous tissue (vessel), lipid pool, and calcifications. Parameter values: Fibrous tissue, c1=368000, c2=0, D1=144000, D2=2.0; Necrotic lipid pool: c1=20000, c2=0, D1=20000, D2=1.5; Calcification: c1=3680000, c2=0, D1=1440000, D2=2.0. Unit: dyn/cm2. (b) Blood viscosity curve compared with experimental data and models used by other authors. Parameter values: our model, μ0=2.3, μ∞ =0.0345, λ=28.28, a=−0.355, b=2; model by Johnston et al., μ0=0.56, μ∞ =0.0345, λ=3.313, a=−0.3216, b=2; model by Johnston et al., μ0=0.1315, μ∞ =0.03, λ=0.5, a=−0.3, b=1.7.

