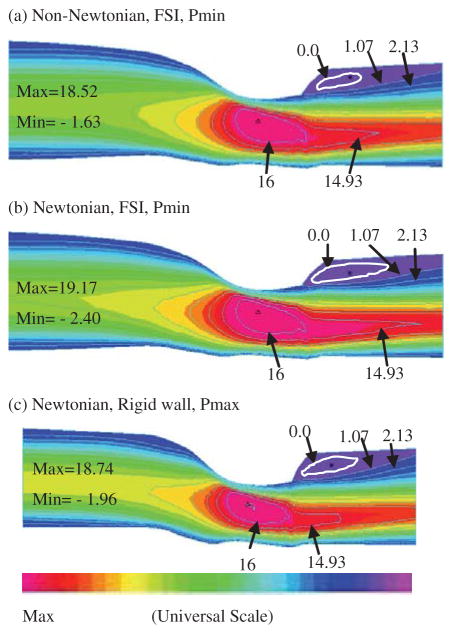
Figure 7.
Comparison of flow velocity (longitudinal or w-component) from three models: Model 1, non-Newtonian fluid with FSI (baseline model); Model 2, Newtonian fluid with FSI; Model 3, Newtonian flow-only rigid wall model. Differences in maximum velocity values are small. Flow stagnation regions with different sizes were observed from all three models.

