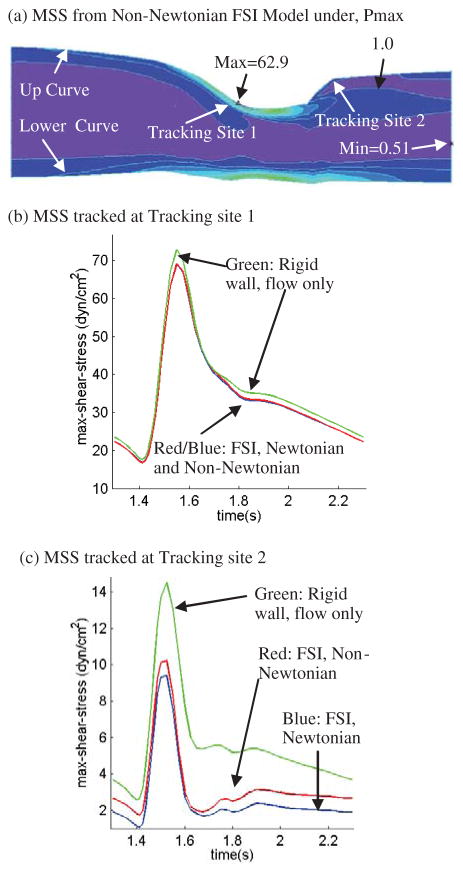
Figure 9.
(a) MSS distributions from the non-Newtonian FSI model corresponding to maximum upstream pressure conditions; (b)–(c). MSS from Models 1–3 tracked at two sites (tracking site 1 corresponds to maximum MSS site; tracking site 2 corresponds to flow-stagnation region) over a cardiac cycle showing rigid-wall model has higher MSS (more than 100%) than that from FSI models and that non-Newtonian FSI model has higher MSS at Site 2 compared to MSS from the Newtonian FSI model.

