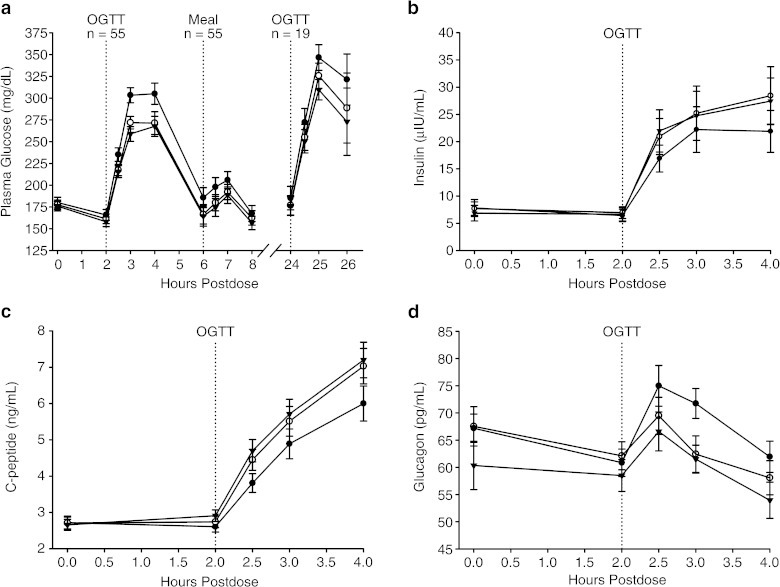
Fig. 4.
Plasma glucose (a), serum insulin (b), serum C-peptide (c), and plasma glucagon (d) concentrations after administration of single oral doses of sitagliptin 25 (white circles) or 200 mg (black triangles) or placebo (black circles) and an OGTT at 2 h postdose. Plasma glucose concentrations are also displayed for the 2 h after a standardized meal at 6 h postdose and an OGTT at 24 h postdose. Data are expressed as geometric mean ± SE. [Reprinted with permission from The Journal of Clinical Endocrinology & Metabolism Vol. 91, No. 11 4612–4619, Copyright 2006, The Endocrine Society]

