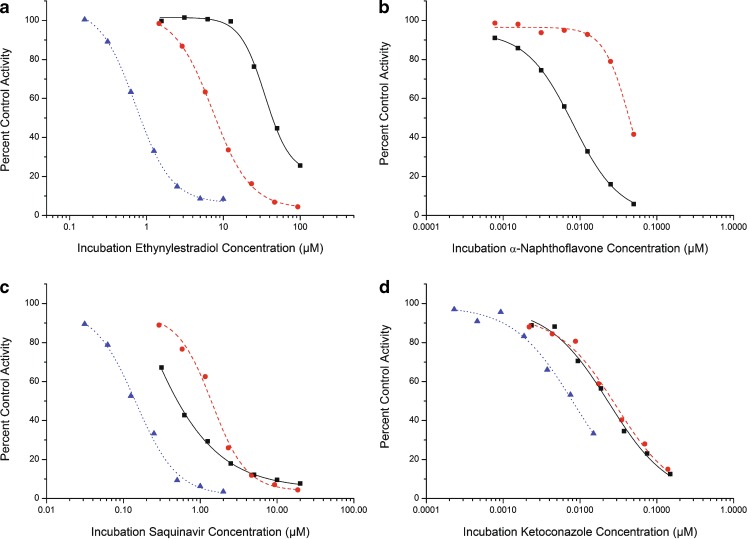
Fig. 5.
Examples of IC50 shift assay for detecting TDI: a Inhibition of human liver microsomal midazolam 1′-hydroxylase activity by 17α-ethynylestradiol. Rightmost curve (squares and solid line, IC50 = 49 μM): determination with no preincubation (0.2 mg/ml HLM, 5 min incubation time). Centre curve (circles and dashed line, IC50 = 8.3 μM): determination with 30 min preincubation in the absence of substrate (0.25 mg/ml HLM in preincubation, 0.2 mg/ml HLM in incubation, 5 min incubation time). Leftmost curve (triangles and dotted line, IC50 = 0.89 μM): determination with 30 min preincubation and 10-fold dilution before incubation (0.2 mg/ml HLM in preincubation, 0.02 mg/ml HLM in incubation, 5 min incubation time). b Experiment examining α-naphthoflavone inhibition of human liver microsomal ethoxyresorufin O-deethylase activity (principally CYP1A2 mediated). Squares and solid line: no preincubation, circles and dashed line: with 30 min preincubation. Preincubation resulted in metabolism of α-naphthoflavone but not in enzyme inactivation, so curve shifted to higher IC50 value. c Human liver microsomal midazolam 1′-hydroxylase activity inhibition by saquinavir. Squares and solid line: no preincubation; circles and dashed line: 30 min preincubation, metabolism of saquinavir in lower concentration incubations outweighs enzyme inactivation so curve shifted to higher IC50 value and sigmoidicity increased; triangles and dotted line: 30 min preincubation and 10-fold dilution allows enzyme inactivation effect to become apparent. d: Human liver microsomal midazolam 1′-hydroxylase activity inhibition by ketoconazole. Squares and solid line: no preincubation; circles and dashed line: 30 min preincubation—no change in apparent inhibition potency as enzyme not inactivated; triangles and dotted line: 30 min preincubation and 10-fold dilution—curve shift to lower IC50 value due to enzyme/protein dilution

