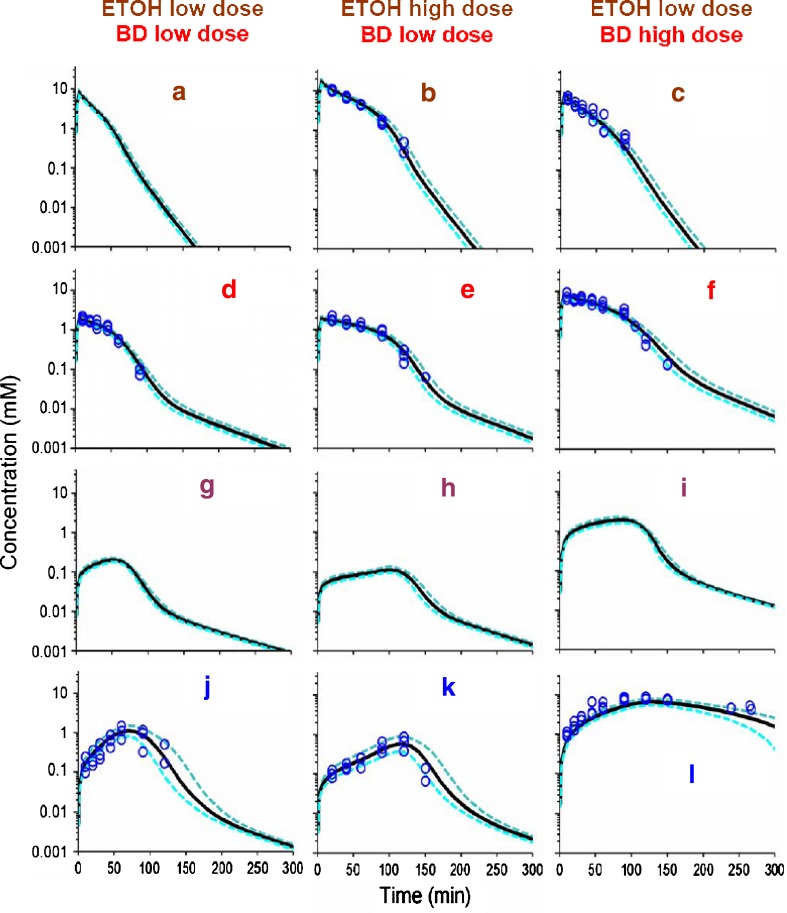
Fig. 5.
VPC for ETOH, BD and GHB after BD/ETOH coadministration for the final population model shown in Fig. 1 and Table II. See legend for Fig. 2 for further details related to the modeling. Data for ETOH in panel a (study #7) were not experimentally monitored, and the curves represent simulated model predictions from the population PK model. Theoretical concentration-time profiles for an unmonitored metabolic intermediate (ALD) are also presented (Panels g–i). a–c ETOH. d–f BD. g–i ALD. j–l GHB

