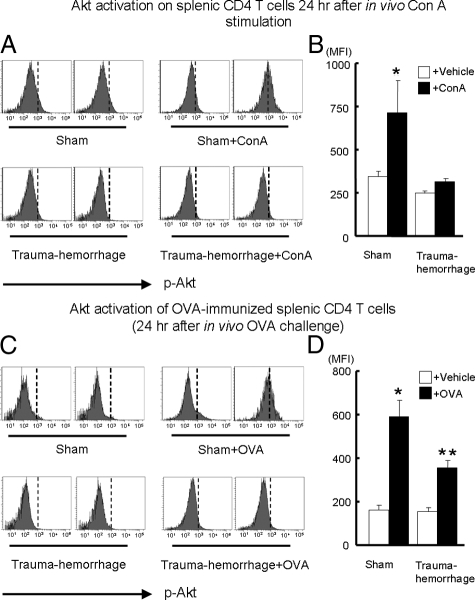
Figure 3.
Expression of phospho-Akt on splenic CD4+ T cells after stimulation with ConA or OVA in vivo. Splenic T cells were activated either by in vivo ConA stimulation or by OVA challenge after prior OVA immunization as described in Materials and Methods. Twenty-four hours after the end of resuscitation, splenocytes with or without stimulation were isolated and surface stained with APC anti-CD4 Ab. Cells were than fixed, permeabilized and stained with Alexa Fluor 488-conjugated anti-p-Akt Ab as described in Materials and Methods. Representative histograms were gated on CD4+ T cells and showed MFI of p-Akt after ConA stimulation (A) or OVA challenge (C). MFI data for p-Akt after ConA stimulation (B) or OVA challenge (D) are shown as mean ± SEM. *P < 0.05 versus. all of the other groups. **P < 0.05 versus vehicle groups. n = 5/group. The vertical dotted line in each histogram is intended for better recognition of the shift of MFI among different treatment groups.

