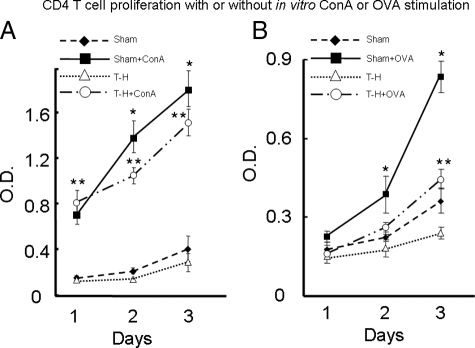
Figure 6.
Proliferation of splenic CD4+ T cells after in vitro ConA or OVA stimulation. The isolation, stimulation, and culture of T cells were the same as in Figures 4 and 5 and are described in Materials and Methods. The proliferation capacities of T cells were measured after 24, 48, and 72 hours of culture, respectively, and were determined using a 5-bromo-2′-deoxyuridine-based, commercially available ELISA kit as described in Materials and Methods. A: T-cell proliferation with or without ConA stimulation. B: T cell proliferation with or without OVA stimulation. Data are shown as mean ± SEM. *P < 0.05 compared with all of the other groups on the same day. **P < 0.05 compared with nonstimulated groups on the same day. n = 5/group.

