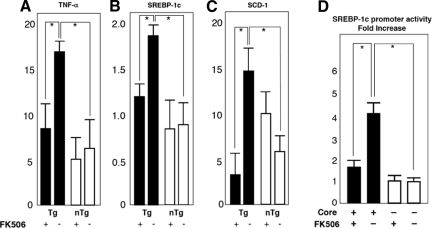
Figure 7.
A–C: Effect of tacrolimus (FK506) on mRNA levels of cellular genes. The mRNA levels of TNF-α (A), SREBP-1c (B), and SCD-1 (C) genes were determined by real-time PCR analysis in the tacrolimus- or vehicle-treated mouse livers. The transcriptions of the genes were normalized with that of hypoxanthine phosphoribosyltransferase, and the values are expressed as relative activities. D: Effect of tacrolimus on the transactivating function of the core protein on the SREBP-1c promoter. A luciferase assay was performed using a plasmid encoding firefly luciferase under the control of the SREBP-1c promoter with or without the expression of HCV core protein. Tacrolimus was added at a final concentration of 100 nmol/L to the culture medium. Black bars represent transgenic mice; white bars represent control cells. Values represent the mean ± SE; n = 5 in each group. *P < 0.05. Tg, transgenic mice; nTg, nontransgenic mice.

