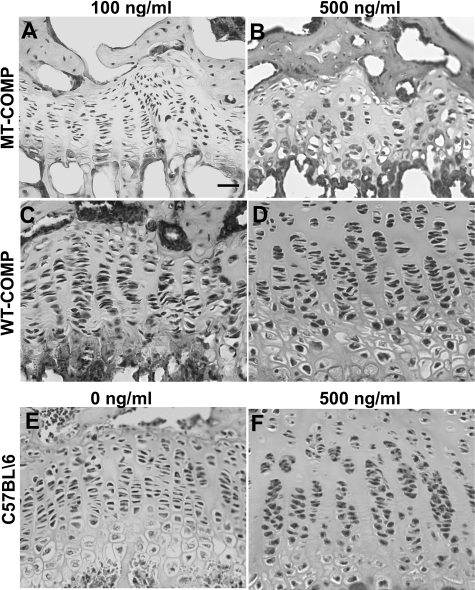
Figure 1.
Growth plate abnormalities are associated with overexpression of MT-COMP. H&E staining of growth plates from MT-COMP (A, B) and WT-COMP (C, D) mice at 1 month that were fed 100 or 500 ng/ml of DOX, respectively. C57BL\6 age-appropriate control growth plates exposed to 0 and 500 ng/ml DOX are shown in E and F. Increasing concentration of DOX is associated with more chondrocyte disorganization and acellular areas in MT-COMP growth plate. Scale bar = 25 μmol/L.

