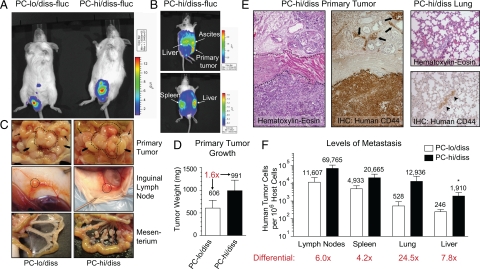
Figure 3.
Characterization of PC-3 dissemination variants in an orthotopic spontaneous metastasis model. A: Bioluminescence imaging of PC-lo/diss or PC-hi/diss primary tumors in SCID mice 5 weeks after surgical implantation of firefly luciferase-tagged cells (fluc) into anterior prostates. B: Bioluminescence imaging from side (top) and dorsal (bottom) views of a mouse bearing a PC-hi/diss tumor 5 weeks after implantation. High levels of bioluminescence are associated with the primary tumor, liver, spleen, and abdominal ascites. C: Gross morphology of primary tumors, lymph nodes and mesenterium in sacrificed mice. The tumors in the prostate area are circumscribed by dotted lines (top panels). Arrows point to seminal vesicles, arrowheads point to testes. Significantly enlarged inguinal (subiliac) lymph nodes are indicated by circles (middle panels). The mesenterium in PC-hi/diss-bearing mice is heavily inseminated with macroscopic metastatic nodules (bottom panels). D: Primary tumors were excised and weighed, indicating a 1.6-fold difference in tumor size between the two PC-3 variants. E: H&E staining of a PC-hi/diss tumor (left panel) indicates the presence of a tumor cell mass at the bottom of the section and tumor invasion between prostate glands at the top of the section. A muscular layer in the middle is indicated by dotted lines. The presence of human tumor cells invaded the prostate glandular tissue (arrows) was confirmed by immunohistochemical staining with mAb 29-7, specifically recognizing human CD44 (middle panel). A section of lung tissue from a mouse bearing PC-hi/diss tumor (right panels) stained with H&E (top). Immunohistochemical staining for human CD44 (brown) confirms the presence of metastatic lesion indicated by the arrowhead (bottom). F: Levels of metastasis in mice bearing PC-lo/diss (open bars) and PC-hi/diss (closed bars) tumors were determined by Alu-qPCR in the lymph nodes, spleen, lung, and liver. Bars are means ± SEM from two independent experiments using six mice total per variant. Numbers above bars are mean numbers of humans cells quantified in the organ per 106 murine cells. *P < 0.05 in one-tailed Mann-Whitney test.

