Figure 7.
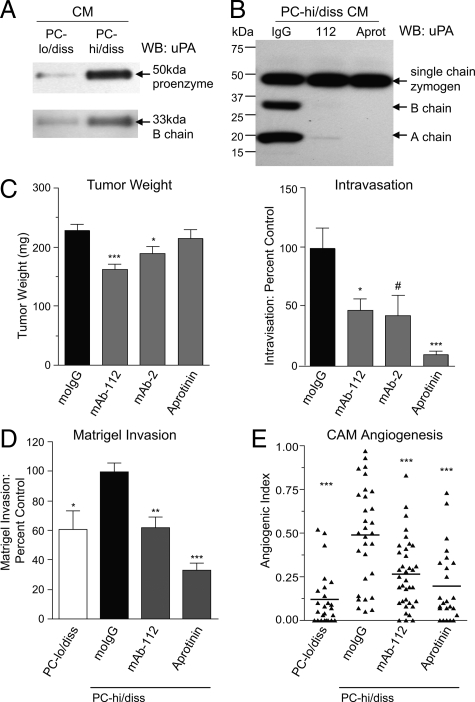
Functional contribution of uPA to PC-hi/diss intravasation, invasion, and angiogenesis. A: Western blot analysis of uPA production by PC-lo/diss and PC-hi/diss cell variants. SDS-PAGE of CM, normalized to equal numbers of adherent cells, was performed under reducing conditions allowing for detection of single chain pro-uPA (top panel) and B chain of the activated uPA enzyme (bottom panel) by goat anti-uPA antibody. B: Western blot analysis of uPA activation by PC-hi/diss cells. CM was harvested from PC-hi/diss cell monolayers incubated for 48 hours with control IgG, mAb-112, or aprotinin. SDS-PAGE of CM samples was performed under reducing conditions. Single chain uPA zymogen, and B chain and A chain of activated two chain uPA were detected by rabbit anti-uPA antibody recognizing all three uPA species. Position of molecular weight markers is indicated in kDa on the left. C: Contribution of uPA activation and activity to PC-hi/diss intravasation. Developing PC-hi/diss CAM tumors were treated topically with control IgG, mAb-112, mAb-2, or aprotinin. After 7 days, primary tumors were weighed (left graph) and intravasation to the distal CAM was quantified by Alu-qPCR (right graph). Presented are means ± SEM from pooled data of three independent experiments using from 22 to 53 embryos per variable. The levels of intravasation are presented as percentage of intravasation determined in the IgG-treated control. D: Contribution of uPA to Matrigel invasion in Transwells. PC-lo/diss or PC-hi/diss cells were stimulated to invade Matrigel toward CM from CEFs. Where indicated, mAb-112 or aprotinin were added to both inner and outer chambers. Presented are means ± SEM from pooled data of three independent experiments performed in duplicate. Data are calculated as percentage of invasion observed in control IgG-treated PC-hi/diss variant. E: Contribution of uPA to CAM angiogenesis. Collagen onplants containing PC-lo/diss cells mixed with control IgG and PC-hi/diss cells mixed with control IgG, mAb-112, or aprotinin were placed onto the CAMs of shell-less chick embryos. The scattergram depicts angiogenic indices in individual collagen onplants from a representative experiment scored at 72 hours; lines are means. *P < 0.05, **P < 0.005, and ***P < 0.001 in two-tailed Student’s t-test; #P < 0.05 in one-tailed Student’s t-test.

