Figure 4.
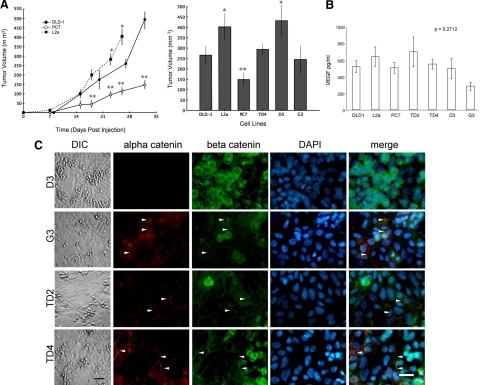
Influence of α-catenin expression on tumor growth in vivo. A: PC7 xenografts grow significantly slower than either DLD-1 parent tumors or L2a cells when grafted s.c. into the flank of immune-deficient mice (**P < 0.05). L2a and D3 clones showed statistically increased tumor volume growth at day 25 compared with PC7 (*P < 0.05). DLD-1 parent and other clones show no significant differences from each other. B: Production of the angiogenic factor vascular endothelial growth factor (VEGF), as detected by enzyme-linked immunosorbent assay, did not differ significantly between the parental cell lines or the clones (P = 0.2712). C: Immunofluorescence of α-catenin expression clones immunostained for α-catenin, β-catenin, and DAPI nuclear counterstain. Differential interference contrast (DIC) images on the left show the morphology of the cell monolayers. All clones except D3 show normalization of the monolayer, with increased areas of adherent monolayer and tight cell-cell boundaries and fewer cells with the “rounding” phenotype. Concomitant with this, all clones except D3 express detectable levels of α-catenin, and the majority of cells have relocalized both α-catenin and β-catenin to cell-cell adhesion points (arrowheads). In contrast, D3 cells retain the disrupted β-catenin localization of their parent L2a. Scale bars = 50 μm.

