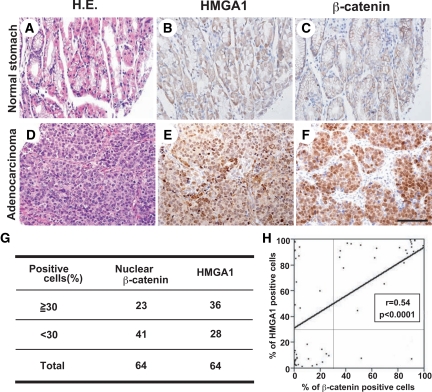
Figure 3.
Correlation between HMGA1 and β-catenin expression in human gastric cancer tissues. Serial sections of normal stomach (A–C) and gastric adenocarcinoma (D–F). Normal and noncancerous tissues showed very weak staining for HMGA1 and nuclear β-catenin. In contrast, HMGA1 and β-catenin were highly accumulated in the nuclei of cancer cells. H&E staining (A, D), immunostaining for HMGA1 (B, E), and nuclear β-catenin (C, F). Scale bar = 100 μm. G: Percentage of HMGA1-positive cells and β-catenin-positive cells in gastric cancer tissues. High expression of HMGA1 was found in 36 out of 64 (56.3%) human primary gastric carcinomas studied, where HMGA1 was densely stained in the nuclei of more than 30% of the cancer cells. Nuclear expression of β-catenin was detected in 23 out of 64 cancer tissues (35.9%), where nuclear β-catenin was stained in more than 30% of the cancer cells. H: Percentage correlations between HMGA1-positive cells and β-catenin-positive cells in gastric cancer tissues. HMGA1-positive cells and β-catenin-positive cells were counted in the same samples (mean, 233; range, 110 to 450). Data were analyzed using Pearson’s correlation coefficient. Supplemental Table S132 at http://ajp.amjpathol.org shows a summary of tumor grade and stage and the immunohistochemical data.

