Figure 6.
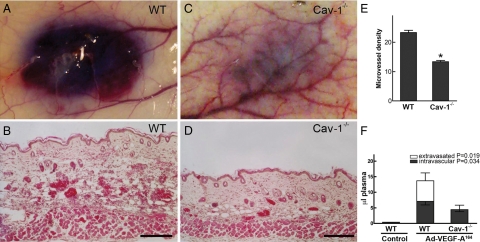
Angiogenic response 4 days after injection of Ad-VEGF-A164 into flank skin of wild-type (WT) (A and B) and cav-1−/− mice (C and D). A and C: Macroscopic appearance of angiogenic sites 30 minutes after i.v. injection of Evans blue dye. Note the striking difference in overall angiogenic response and bluing intensity between wild-type and cav-1−/− mice. B and D: Histological analysis shows striking angiogenesis with mother vessel formation and edema in wild-type versus cav-1−/− reactions; differences in skin thickness reflect differences in tissue edema. E: Microvascular density (mean ± SEM) as determined in wild-type (N = 7) and cav-1−/− (N = 6) angiogenic sites. *P < 0.0001. F: Intravascular and extravasated volumes (microliters) of plasma (mean ± SEM) in skin sites of wild-type (N = 8) versus cav-1−/− (N = 8) mice injected 4 days previously with Ad-VEGF-A164. See Materials and Methods and references45,48 for calculations. Magnification bars = 100 μm.

